Immigrants from Vietnam vs Jordanian Seniors Poverty Over the Age of 75
COMPARE
Immigrants from Vietnam
Jordanian
Seniors Poverty Over the Age of 75
Seniors Poverty Over the Age of 75 Comparison
Immigrants from Vietnam
Jordanians
12.7%
SENIORS POVERTY OVER THE AGE OF 75
12.1/ 100
METRIC RATING
200th/ 347
METRIC RANK
11.6%
SENIORS POVERTY OVER THE AGE OF 75
90.8/ 100
METRIC RATING
101st/ 347
METRIC RANK
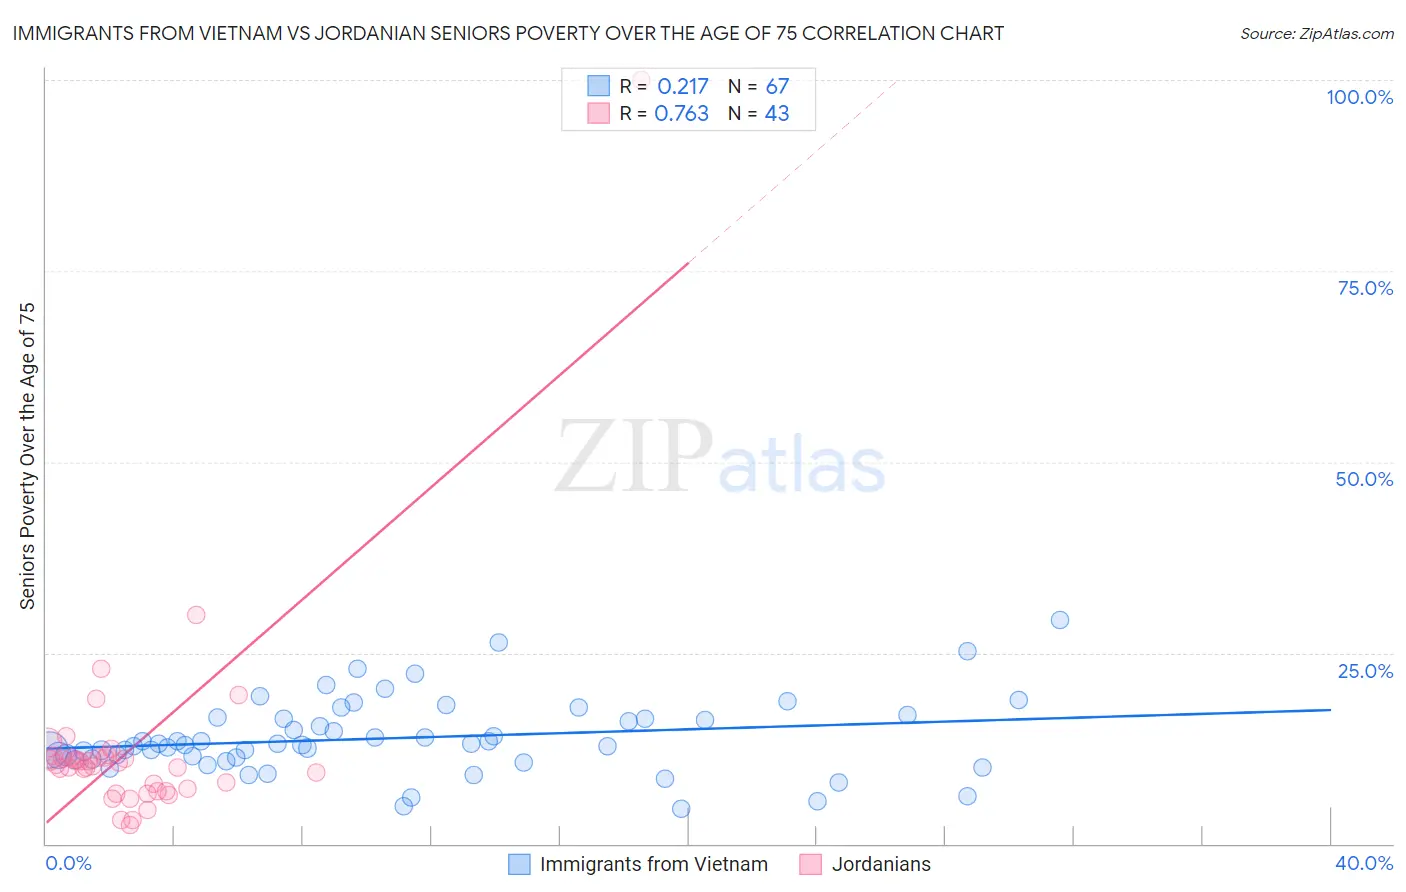
Immigrants from Vietnam vs Jordanian Seniors Poverty Over the Age of 75 Correlation Chart
The statistical analysis conducted on geographies consisting of 400,421,667 people shows a weak positive correlation between the proportion of Immigrants from Vietnam and poverty level among seniors over the age of 75 in the United States with a correlation coefficient (R) of 0.217 and weighted average of 12.7%. Similarly, the statistical analysis conducted on geographies consisting of 165,896,130 people shows a strong positive correlation between the proportion of Jordanians and poverty level among seniors over the age of 75 in the United States with a correlation coefficient (R) of 0.763 and weighted average of 11.6%, a difference of 9.1%.
Seniors Poverty Over the Age of 75 Correlation Summary
| Measurement | Immigrants from Vietnam | Jordanian |
| Minimum | 4.6% | 2.4% |
| Maximum | 29.4% | 100.0% |
| Range | 24.8% | 97.6% |
| Mean | 13.8% | 12.5% |
| Median | 13.0% | 10.4% |
| Interquartile 25% (IQ1) | 11.1% | 6.9% |
| Interquartile 75% (IQ3) | 16.4% | 11.3% |
| Interquartile Range (IQR) | 5.3% | 4.4% |
| Standard Deviation (Sample) | 4.9% | 14.6% |
| Standard Deviation (Population) | 4.9% | 14.4% |
Similar Demographics by Seniors Poverty Over the Age of 75
Demographics Similar to Immigrants from Vietnam by Seniors Poverty Over the Age of 75
In terms of seniors poverty over the age of 75, the demographic groups most similar to Immigrants from Vietnam are Immigrants from Lebanon (12.7%, a difference of 0.10%), Paraguayan (12.7%, a difference of 0.20%), Arapaho (12.7%, a difference of 0.23%), Chilean (12.6%, a difference of 0.27%), and Immigrants from Southern Europe (12.7%, a difference of 0.29%).
| Demographics | Rating | Rank | Seniors Poverty Over the Age of 75 |
| Taiwanese | 17.8 /100 | #193 | Poor 12.6% |
| Alsatians | 17.7 /100 | #194 | Poor 12.6% |
| Immigrants | France | 17.4 /100 | #195 | Poor 12.6% |
| Immigrants | Eastern Europe | 16.0 /100 | #196 | Poor 12.6% |
| Nepalese | 14.4 /100 | #197 | Poor 12.6% |
| Chileans | 13.7 /100 | #198 | Poor 12.6% |
| Immigrants | Lebanon | 12.7 /100 | #199 | Poor 12.7% |
| Immigrants | Vietnam | 12.1 /100 | #200 | Poor 12.7% |
| Paraguayans | 11.1 /100 | #201 | Poor 12.7% |
| Arapaho | 10.9 /100 | #202 | Poor 12.7% |
| Immigrants | Southern Europe | 10.7 /100 | #203 | Poor 12.7% |
| Immigrants | Eritrea | 10.5 /100 | #204 | Poor 12.7% |
| Indians (Asian) | 9.7 /100 | #205 | Tragic 12.7% |
| Albanians | 9.6 /100 | #206 | Tragic 12.7% |
| Costa Ricans | 8.7 /100 | #207 | Tragic 12.8% |
Demographics Similar to Jordanians by Seniors Poverty Over the Age of 75
In terms of seniors poverty over the age of 75, the demographic groups most similar to Jordanians are Guamanian/Chamorro (11.6%, a difference of 0.040%), Syrian (11.6%, a difference of 0.080%), Immigrants from Kuwait (11.6%, a difference of 0.080%), Immigrants from Singapore (11.6%, a difference of 0.13%), and Chickasaw (11.6%, a difference of 0.14%).
| Demographics | Rating | Rank | Seniors Poverty Over the Age of 75 |
| Creek | 92.7 /100 | #94 | Exceptional 11.6% |
| Immigrants | Bosnia and Herzegovina | 92.6 /100 | #95 | Exceptional 11.6% |
| Immigrants | Sweden | 92.6 /100 | #96 | Exceptional 11.6% |
| Romanians | 92.3 /100 | #97 | Exceptional 11.6% |
| Immigrants | Japan | 91.9 /100 | #98 | Exceptional 11.6% |
| Immigrants | Ethiopia | 91.7 /100 | #99 | Exceptional 11.6% |
| Syrians | 91.1 /100 | #100 | Exceptional 11.6% |
| Jordanians | 90.8 /100 | #101 | Exceptional 11.6% |
| Guamanians/Chamorros | 90.6 /100 | #102 | Exceptional 11.6% |
| Immigrants | Kuwait | 90.5 /100 | #103 | Exceptional 11.6% |
| Immigrants | Singapore | 90.3 /100 | #104 | Exceptional 11.6% |
| Chickasaw | 90.2 /100 | #105 | Exceptional 11.6% |
| Russians | 89.9 /100 | #106 | Excellent 11.6% |
| Immigrants | Oceania | 89.4 /100 | #107 | Excellent 11.7% |
| Turks | 89.4 /100 | #108 | Excellent 11.7% |