Immigrants from Germany vs Jordanian Seniors Poverty Over the Age of 75
COMPARE
Immigrants from Germany
Jordanian
Seniors Poverty Over the Age of 75
Seniors Poverty Over the Age of 75 Comparison
Immigrants from Germany
Jordanians
11.5%
SENIORS POVERTY OVER THE AGE OF 75
94.1/ 100
METRIC RATING
91st/ 347
METRIC RANK
11.6%
SENIORS POVERTY OVER THE AGE OF 75
90.8/ 100
METRIC RATING
101st/ 347
METRIC RANK
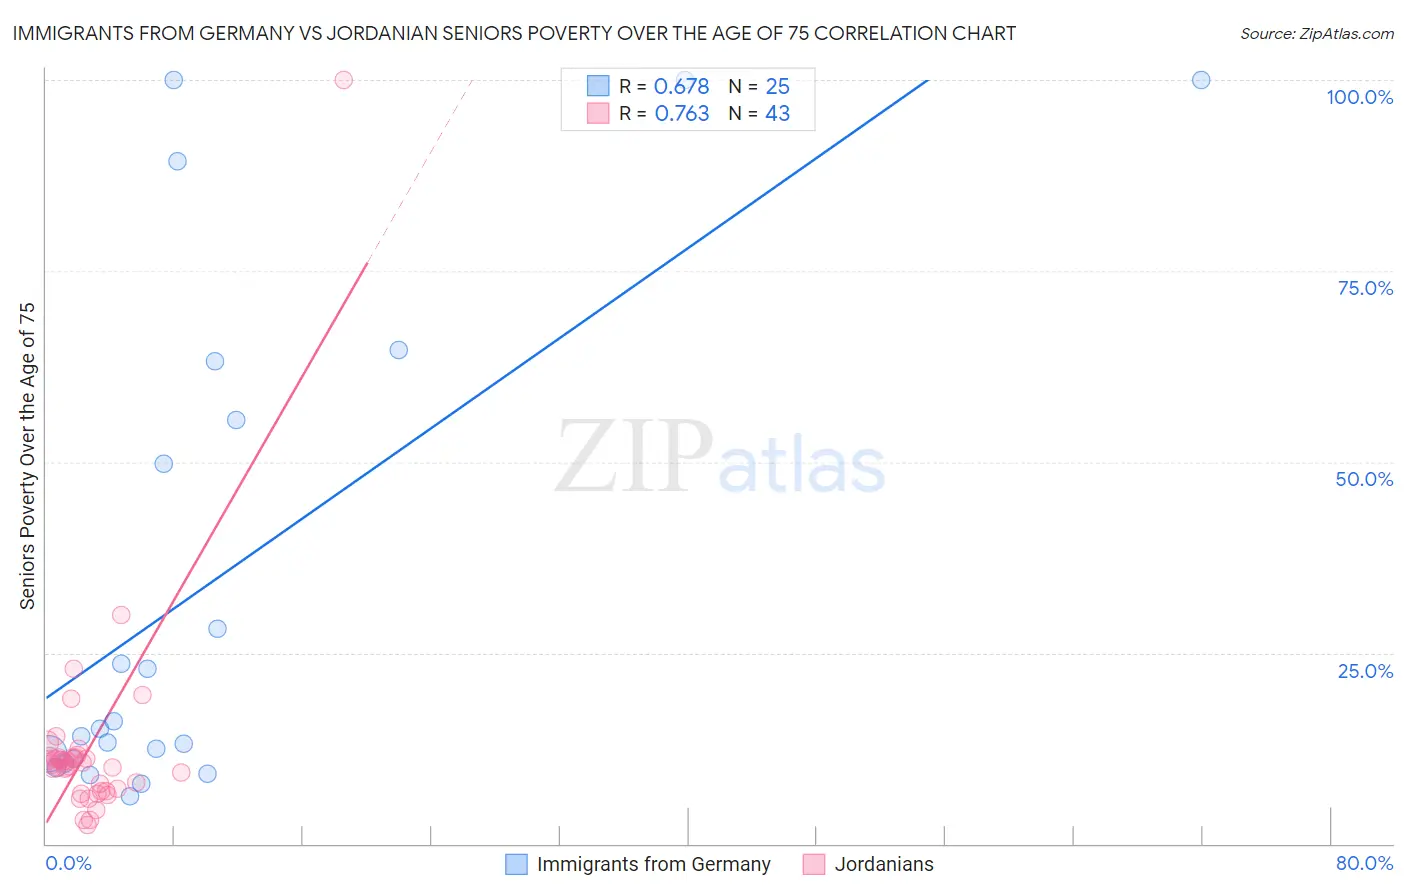
Immigrants from Germany vs Jordanian Seniors Poverty Over the Age of 75 Correlation Chart
The statistical analysis conducted on geographies consisting of 457,232,902 people shows a significant positive correlation between the proportion of Immigrants from Germany and poverty level among seniors over the age of 75 in the United States with a correlation coefficient (R) of 0.678 and weighted average of 11.5%. Similarly, the statistical analysis conducted on geographies consisting of 165,896,130 people shows a strong positive correlation between the proportion of Jordanians and poverty level among seniors over the age of 75 in the United States with a correlation coefficient (R) of 0.763 and weighted average of 11.6%, a difference of 1.0%.
Seniors Poverty Over the Age of 75 Correlation Summary
| Measurement | Immigrants from Germany | Jordanian |
| Minimum | 6.2% | 2.4% |
| Maximum | 100.0% | 100.0% |
| Range | 93.8% | 97.6% |
| Mean | 34.3% | 12.5% |
| Median | 15.1% | 10.4% |
| Interquartile 25% (IQ1) | 10.8% | 6.9% |
| Interquartile 75% (IQ3) | 59.4% | 11.3% |
| Interquartile Range (IQR) | 48.6% | 4.4% |
| Standard Deviation (Sample) | 33.0% | 14.6% |
| Standard Deviation (Population) | 32.3% | 14.4% |
Demographics Similar to Immigrants from Germany and Jordanians by Seniors Poverty Over the Age of 75
In terms of seniors poverty over the age of 75, the demographic groups most similar to Immigrants from Germany are Aleut (11.5%, a difference of 0.020%), Kenyan (11.5%, a difference of 0.070%), Immigrants from Sri Lanka (11.5%, a difference of 0.13%), Immigrants from Croatia (11.5%, a difference of 0.16%), and Korean (11.5%, a difference of 0.18%). Similarly, the demographic groups most similar to Jordanians are Guamanian/Chamorro (11.6%, a difference of 0.040%), Syrian (11.6%, a difference of 0.080%), Immigrants from Kuwait (11.6%, a difference of 0.080%), Immigrants from Singapore (11.6%, a difference of 0.13%), and Chickasaw (11.6%, a difference of 0.14%).
| Demographics | Rating | Rank | Seniors Poverty Over the Age of 75 |
| Australians | 94.6 /100 | #86 | Exceptional 11.5% |
| Koreans | 94.5 /100 | #87 | Exceptional 11.5% |
| Immigrants | Croatia | 94.5 /100 | #88 | Exceptional 11.5% |
| Immigrants | Sri Lanka | 94.4 /100 | #89 | Exceptional 11.5% |
| Aleuts | 94.1 /100 | #90 | Exceptional 11.5% |
| Immigrants | Germany | 94.1 /100 | #91 | Exceptional 11.5% |
| Kenyans | 93.9 /100 | #92 | Exceptional 11.5% |
| Immigrants | Poland | 92.9 /100 | #93 | Exceptional 11.6% |
| Creek | 92.7 /100 | #94 | Exceptional 11.6% |
| Immigrants | Bosnia and Herzegovina | 92.6 /100 | #95 | Exceptional 11.6% |
| Immigrants | Sweden | 92.6 /100 | #96 | Exceptional 11.6% |
| Romanians | 92.3 /100 | #97 | Exceptional 11.6% |
| Immigrants | Japan | 91.9 /100 | #98 | Exceptional 11.6% |
| Immigrants | Ethiopia | 91.7 /100 | #99 | Exceptional 11.6% |
| Syrians | 91.1 /100 | #100 | Exceptional 11.6% |
| Jordanians | 90.8 /100 | #101 | Exceptional 11.6% |
| Guamanians/Chamorros | 90.6 /100 | #102 | Exceptional 11.6% |
| Immigrants | Kuwait | 90.5 /100 | #103 | Exceptional 11.6% |
| Immigrants | Singapore | 90.3 /100 | #104 | Exceptional 11.6% |
| Chickasaw | 90.2 /100 | #105 | Exceptional 11.6% |
| Russians | 89.9 /100 | #106 | Excellent 11.6% |