West Indian vs Immigrants from Albania Seniors Poverty Over the Age of 75
COMPARE
West Indian
Immigrants from Albania
Seniors Poverty Over the Age of 75
Seniors Poverty Over the Age of 75 Comparison
West Indians
Immigrants from Albania
15.7%
SENIORS POVERTY OVER THE AGE OF 75
0.0/ 100
METRIC RATING
302nd/ 347
METRIC RANK
13.6%
SENIORS POVERTY OVER THE AGE OF 75
0.3/ 100
METRIC RATING
249th/ 347
METRIC RANK
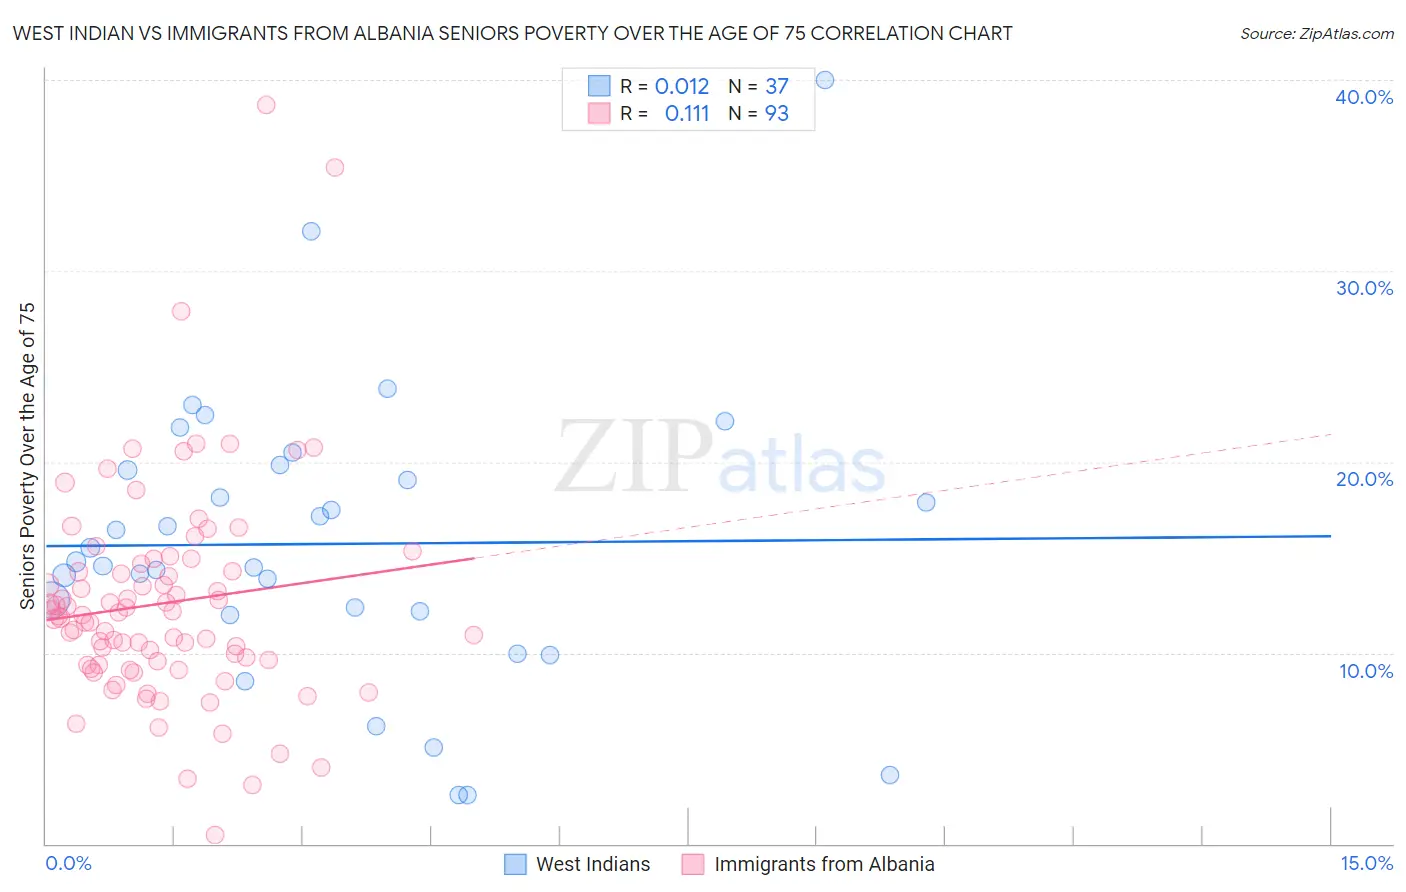
West Indian vs Immigrants from Albania Seniors Poverty Over the Age of 75 Correlation Chart
The statistical analysis conducted on geographies consisting of 252,374,220 people shows no correlation between the proportion of West Indians and poverty level among seniors over the age of 75 in the United States with a correlation coefficient (R) of 0.012 and weighted average of 15.7%. Similarly, the statistical analysis conducted on geographies consisting of 118,864,041 people shows a poor positive correlation between the proportion of Immigrants from Albania and poverty level among seniors over the age of 75 in the United States with a correlation coefficient (R) of 0.111 and weighted average of 13.6%, a difference of 15.2%.
Seniors Poverty Over the Age of 75 Correlation Summary
| Measurement | West Indian | Immigrants from Albania |
| Minimum | 2.6% | 0.46% |
| Maximum | 40.0% | 38.7% |
| Range | 37.4% | 38.2% |
| Mean | 15.7% | 12.6% |
| Median | 14.8% | 11.9% |
| Interquartile 25% (IQ1) | 12.1% | 9.3% |
| Interquartile 75% (IQ3) | 19.7% | 14.5% |
| Interquartile Range (IQR) | 7.6% | 5.1% |
| Standard Deviation (Sample) | 7.6% | 5.8% |
| Standard Deviation (Population) | 7.5% | 5.7% |
Similar Demographics by Seniors Poverty Over the Age of 75
Demographics Similar to West Indians by Seniors Poverty Over the Age of 75
In terms of seniors poverty over the age of 75, the demographic groups most similar to West Indians are Immigrants from Honduras (15.7%, a difference of 0.17%), Immigrants from Latin America (15.6%, a difference of 0.31%), Immigrants from Trinidad and Tobago (15.7%, a difference of 0.35%), Ecuadorian (15.7%, a difference of 0.39%), and Hispanic or Latino (15.8%, a difference of 0.55%).
| Demographics | Rating | Rank | Seniors Poverty Over the Age of 75 |
| U.S. Virgin Islanders | 0.0 /100 | #295 | Tragic 15.4% |
| Yuman | 0.0 /100 | #296 | Tragic 15.4% |
| Hondurans | 0.0 /100 | #297 | Tragic 15.4% |
| Natives/Alaskans | 0.0 /100 | #298 | Tragic 15.5% |
| Spanish American Indians | 0.0 /100 | #299 | Tragic 15.5% |
| Bahamians | 0.0 /100 | #300 | Tragic 15.5% |
| Immigrants | Latin America | 0.0 /100 | #301 | Tragic 15.6% |
| West Indians | 0.0 /100 | #302 | Tragic 15.7% |
| Immigrants | Honduras | 0.0 /100 | #303 | Tragic 15.7% |
| Immigrants | Trinidad and Tobago | 0.0 /100 | #304 | Tragic 15.7% |
| Ecuadorians | 0.0 /100 | #305 | Tragic 15.7% |
| Hispanics or Latinos | 0.0 /100 | #306 | Tragic 15.8% |
| Immigrants | West Indies | 0.0 /100 | #307 | Tragic 15.8% |
| Immigrants | Bangladesh | 0.0 /100 | #308 | Tragic 15.8% |
| Yup'ik | 0.0 /100 | #309 | Tragic 15.8% |
Demographics Similar to Immigrants from Albania by Seniors Poverty Over the Age of 75
In terms of seniors poverty over the age of 75, the demographic groups most similar to Immigrants from Albania are African (13.6%, a difference of 0.010%), Mexican American Indian (13.6%, a difference of 0.010%), Immigrants from Ukraine (13.6%, a difference of 0.040%), Immigrants from Peru (13.7%, a difference of 0.34%), and Immigrants from Argentina (13.7%, a difference of 0.39%).
| Demographics | Rating | Rank | Seniors Poverty Over the Age of 75 |
| Immigrants | Somalia | 0.6 /100 | #242 | Tragic 13.5% |
| Dutch West Indians | 0.6 /100 | #243 | Tragic 13.5% |
| Spanish Americans | 0.5 /100 | #244 | Tragic 13.5% |
| Uruguayans | 0.5 /100 | #245 | Tragic 13.5% |
| Immigrants | Cambodia | 0.4 /100 | #246 | Tragic 13.6% |
| Immigrants | Ukraine | 0.3 /100 | #247 | Tragic 13.6% |
| Africans | 0.3 /100 | #248 | Tragic 13.6% |
| Immigrants | Albania | 0.3 /100 | #249 | Tragic 13.6% |
| Mexican American Indians | 0.3 /100 | #250 | Tragic 13.6% |
| Immigrants | Peru | 0.3 /100 | #251 | Tragic 13.7% |
| Immigrants | Argentina | 0.3 /100 | #252 | Tragic 13.7% |
| Immigrants | Spain | 0.2 /100 | #253 | Tragic 13.7% |
| Blackfeet | 0.2 /100 | #254 | Tragic 13.7% |
| Immigrants | Belarus | 0.2 /100 | #255 | Tragic 13.8% |
| Inupiat | 0.1 /100 | #256 | Tragic 13.8% |