Indian (Asian) vs Immigrants from Uganda Receiving Food Stamps

COMPARE

Indian (Asian)
Race
Ancestry
AfghanAfricanAlaska NativeAlaskan AthabascanAlbanianAleutAlsatianAmericanApacheArabArapahoArgentineanArmenianAssyrian/Chaldean/SyriacAustralianAustrianBahamianBangladeshiBarbadianBasqueBelgianBelizeanBermudanBhutaneseBlackfeetBolivianBrazilianBritishBritish West IndianBulgarianBurmeseCajunCambodianCanadianCape VerdeanCarpatho RusynCelticCentral AmericanCentral American IndianCherokeeCheyenneChickasawChileanChineseChippewaChoctawColombianColvilleComancheCosta RicanCreeCreekCroatianCrowCubanCypriotCzechCzechoslovakianDanishDelawareDominicanDutchDutch West IndianEastern EuropeanEcuadorianEgyptianEnglishEstonianEthiopianEuropeanFijianFilipinoFinnishFrenchFrench American IndianFrench CanadianGermanGerman RussianGhanaianGreekGuamanian/ChamorroGuatemalanGuyaneseHaitianHmongHonduranHopiHoumaHungarianIcelanderIndian (Asian)IndonesianInupiatIranianIraqiIrishIroquoisIsraeliItalianJamaicanJapaneseJordanianKenyanKiowaKoreanLaotianLatvianLebaneseLiberianLithuanianLumbeeLuxembourgerMacedonianMalaysianMalteseMarshalleseMenomineeMexicanMexican American IndianMongolianMoroccanNative HawaiianNavajoNepaleseNew ZealanderNicaraguanNigerianNorthern EuropeanNorwegianOkinawanOsageOttawaPaiutePakistaniPalestinianPanamanianParaguayanPennsylvania GermanPeruvianPimaPolishPortuguesePotawatomiPuebloPuerto RicanPuget Sound SalishRomanianRussianSalvadoranSamoanScandinavianScotch-IrishScottishSeminoleSenegaleseSerbianShoshoneSierra LeoneanSiouxSlavicSlovakSloveneSomaliSouth AfricanSouth AmericanSouth American IndianSoviet UnionSpaniardSpanishSpanish AmericanSpanish American IndianSri LankanSubsaharan AfricanSudaneseSwedishSwissSyrianTaiwaneseThaiTlingit-HaidaTohono O'OdhamTonganTrinidadian and TobagonianTsimshianTurkishU.S. Virgin IslanderUgandanUkrainianUruguayanUteVenezuelanVietnameseWelshWest IndianYakamaYaquiYugoslavianYumanYup'ikZimbabwean
Immigration
NonimmigrantsImmigrantsAfghanistanAfricaAlbaniaArgentinaArmeniaAsiaAustraliaAustriaBahamasBangladeshBarbadosBelarusBelgiumBelizeBoliviaBosnia and HerzegovinaBrazilBulgariaBurma/MyanmarCabo VerdeCambodiaCameroonCanadaCaribbeanCentral AmericaChileChinaColombiaCongoCosta RicaCroatiaCubaCzechoslovakiaDenmarkDominicaDominican RepublicEastern AfricaEastern AsiaEastern EuropeEcuadorEgyptEl SalvadorEnglandEritreaEthiopiaEuropeFijiFranceGermanyGhanaGreeceGrenadaGuatemalaGuyanaHaitiHondurasHong KongHungaryIndiaIndonesiaIranIraqIrelandIsraelItalyJamaicaJapanJordanKazakhstanKenyaKoreaKuwaitLaosLatin AmericaLatviaLebanonLiberiaLithuaniaMalaysiaMexicoMicronesiaMiddle AfricaMoldovaMoroccoNepalNetherlandsNicaraguaNigeriaNorth AmericaNorth MacedoniaNorthern AfricaNorthern EuropeNorwayOceaniaPakistanPanamaPeruPhilippinesPolandPortugalRomaniaRussiaSaudi ArabiaScotlandSenegalSerbiaSierra LeoneSingaporeSomaliaSouth AfricaSouth AmericaSouth Central AsiaSouth Eastern AsiaSouthern EuropeSpainSri LankaSt. Vincent and the GrenadinesSudanSwedenSwitzerlandSyriaTaiwanThailandTrinidad and TobagoTurkeyUkraineUruguayUzbekistanVenezuelaVietnamWest IndiesWestern AfricaWestern AsiaWestern EuropeYemenZaireZimbabweAzores
Immigrants from Uganda
Race
Ancestry
AfghanAfricanAlaska NativeAlaskan AthabascanAlbanianAleutAlsatianAmericanApacheArabArapahoArgentineanArmenianAssyrian/Chaldean/SyriacAustralianAustrianBahamianBangladeshiBarbadianBasqueBelgianBelizeanBermudanBhutaneseBlackfeetBolivianBrazilianBritishBritish West IndianBulgarianBurmeseCajunCambodianCanadianCape VerdeanCarpatho RusynCelticCentral AmericanCentral American IndianCherokeeCheyenneChickasawChileanChineseChippewaChoctawColombianColvilleComancheCosta RicanCreeCreekCroatianCrowCubanCypriotCzechCzechoslovakianDanishDelawareDominicanDutchDutch West IndianEastern EuropeanEcuadorianEgyptianEnglishEstonianEthiopianEuropeanFijianFilipinoFinnishFrenchFrench American IndianFrench CanadianGermanGerman RussianGhanaianGreekGuamanian/ChamorroGuatemalanGuyaneseHaitianHmongHonduranHopiHoumaHungarianIcelanderIndonesianInupiatIranianIraqiIrishIroquoisIsraeliItalianJamaicanJapaneseJordanianKenyanKiowaKoreanLaotianLatvianLebaneseLiberianLithuanianLumbeeLuxembourgerMacedonianMalaysianMalteseMarshalleseMenomineeMexicanMexican American IndianMongolianMoroccanNative HawaiianNavajoNepaleseNew ZealanderNicaraguanNigerianNorthern EuropeanNorwegianOkinawanOsageOttawaPaiutePakistaniPalestinianPanamanianParaguayanPennsylvania GermanPeruvianPimaPolishPortuguesePotawatomiPuebloPuerto RicanPuget Sound SalishRomanianRussianSalvadoranSamoanScandinavianScotch-IrishScottishSeminoleSenegaleseSerbianShoshoneSierra LeoneanSiouxSlavicSlovakSloveneSomaliSouth AfricanSouth AmericanSouth American IndianSoviet UnionSpaniardSpanishSpanish AmericanSpanish American IndianSri LankanSubsaharan AfricanSudaneseSwedishSwissSyrianTaiwaneseThaiTlingit-HaidaTohono O'OdhamTonganTrinidadian and TobagonianTsimshianTurkishU.S. Virgin IslanderUgandanUkrainianUruguayanUteVenezuelanVietnameseWelshWest IndianYakamaYaquiYugoslavianYumanYup'ikZimbabwean
Immigration
NonimmigrantsImmigrantsAfghanistanAfricaAlbaniaArgentinaArmeniaAsiaAustraliaAustriaBahamasBangladeshBarbadosBelarusBelgiumBelizeBoliviaBosnia and HerzegovinaBrazilBulgariaBurma/MyanmarCabo VerdeCambodiaCameroonCanadaCaribbeanCentral AmericaChileChinaColombiaCongoCosta RicaCroatiaCubaCzechoslovakiaDenmarkDominicaDominican RepublicEastern AfricaEastern AsiaEastern EuropeEcuadorEgyptEl SalvadorEnglandEritreaEthiopiaEuropeFijiFranceGermanyGhanaGreeceGrenadaGuatemalaGuyanaHaitiHondurasHong KongHungaryIndiaIndonesiaIranIraqIrelandIsraelItalyJamaicaJapanJordanKazakhstanKenyaKoreaKuwaitLaosLatin AmericaLatviaLebanonLiberiaLithuaniaMalaysiaMexicoMicronesiaMiddle AfricaMoldovaMoroccoNepalNetherlandsNicaraguaNigeriaNorth AmericaNorth MacedoniaNorthern AfricaNorthern EuropeNorwayOceaniaPakistanPanamaPeruPhilippinesPolandPortugalRomaniaRussiaSaudi ArabiaScotlandSenegalSerbiaSierra LeoneSingaporeSomaliaSouth AfricaSouth AmericaSouth Central AsiaSouth Eastern AsiaSouthern EuropeSpainSri LankaSt. Vincent and the GrenadinesSudanSwedenSwitzerlandSyriaTaiwanThailandTrinidad and TobagoTurkeyUgandaUkraineUruguayUzbekistanVenezuelaVietnamWest IndiesWestern AfricaWestern AsiaWestern EuropeYemenZaireZimbabweAzores
Receiving Food Stamps
Income
Poverty
Unemployment
Labor Participation
Family Structure
Vehicle Availability
Education Level
Disability

Receiving Food Stamps Comparison

Indians (Asian)

Immigrants from Uganda

Exceptional
Average
9.6%
RECEIVING FOOD STAMPS
99.4/ 100
METRIC RATING
47th/ 347
METRIC RANK
11.9%
RECEIVING FOOD STAMPS
40.3/ 100
METRIC RATING
183rd/ 347
METRIC RANK

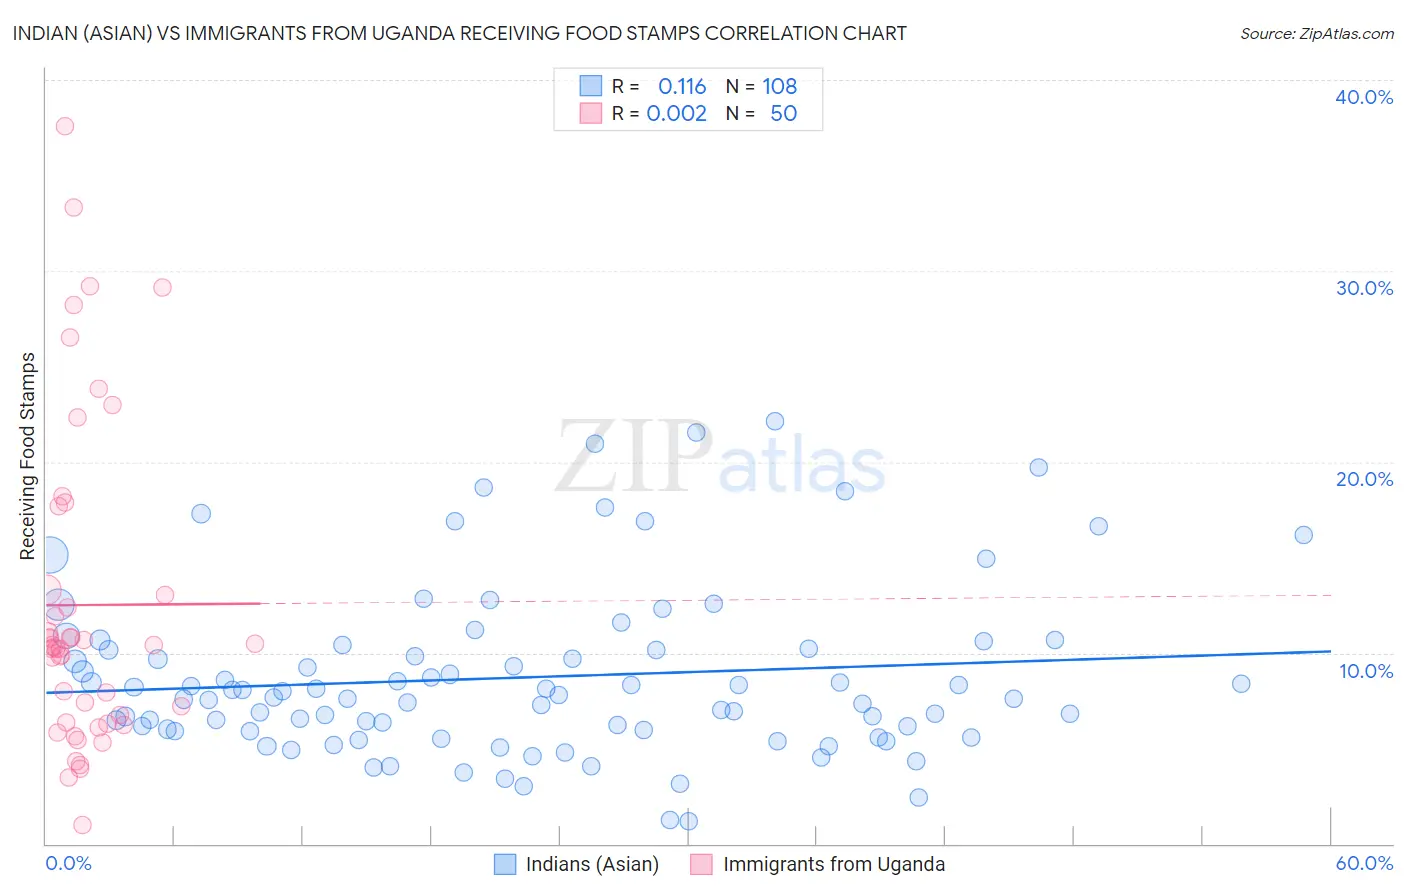
Indian (Asian) vs Immigrants from Uganda Receiving Food Stamps Correlation Chart

The statistical analysis conducted on geographies consisting of 492,865,667 people shows a poor positive correlation between the proportion of Indians (Asian) and percentage of population receiving government assistance and/or food stamps in the United States with a correlation coefficient (R) of 0.116 and weighted average of 9.6%. Similarly, the statistical analysis conducted on geographies consisting of 125,947,478 people shows no correlation between the proportion of Immigrants from Uganda and percentage of population receiving government assistance and/or food stamps in the United States with a correlation coefficient (R) of 0.002 and weighted average of 11.9%, a difference of 23.6%.
Indian (Asian) vs Immigrants from Uganda Receiving Food Stamps

Receiving Food Stamps Correlation Summary

MeasurementIndian (Asian)Immigrants from Uganda
Minimum1.2%1.0%
Maximum22.2%37.6%
Range21.0%36.6%
Mean8.7%12.5%
Median7.7%10.3%
Interquartile 25% (IQ1)5.9%6.4%
Interquartile 75% (IQ3)10.2%13.3%
Interquartile Range (IQR)4.2%6.9%
Standard Deviation (Sample)4.4%8.4%
Standard Deviation (Population)4.4%8.3%

Similar Demographics by Receiving Food Stamps

Demographics Similar to Indians (Asian) by Receiving Food Stamps

In terms of receiving food stamps, the demographic groups most similar to Indians (Asian) are Australian (9.6%, a difference of 0.070%), Russian (9.6%, a difference of 0.11%), Immigrants from Czechoslovakia (9.6%, a difference of 0.13%), Immigrants from Belgium (9.6%, a difference of 0.15%), and Immigrants from Denmark (9.6%, a difference of 0.17%).
DemographicsRating | RankReceiving Food Stamps
Immigrants | Netherlands
99.5
/100
|
#40
Exceptional
9.5%
Cambodians
99.5
/100
|
#41
Exceptional
9.5%
Immigrants | China
99.5
/100
|
#42
Exceptional
9.6%
Croatians
99.5
/100
|
#43
Exceptional
9.6%
Immigrants | Denmark
99.4
/100
|
#44
Exceptional
9.6%
Immigrants | Belgium
99.4
/100
|
#45
Exceptional
9.6%
Australians
99.4
/100
|
#46
Exceptional
9.6%
Indians (Asian)
99.4
/100
|
#47
Exceptional
9.6%
Russians
99.4
/100
|
#48
Exceptional
9.6%
Immigrants | Czechoslovakia
99.4
/100
|
#49
Exceptional
9.6%
Lithuanians
99.4
/100
|
#50
Exceptional
9.7%
Asians
99.3
/100
|
#51
Exceptional
9.7%
Immigrants | South Africa
99.3
/100
|
#52
Exceptional
9.7%
Tongans
99.3
/100
|
#53
Exceptional
9.7%
Swiss
99.3
/100
|
#54
Exceptional
9.7%

Demographics Similar to Immigrants from Uganda by Receiving Food Stamps

In terms of receiving food stamps, the demographic groups most similar to Immigrants from Uganda are Immigrants from Morocco (11.9%, a difference of 0.060%), Spaniard (11.9%, a difference of 0.080%), South American Indian (11.9%, a difference of 0.20%), Immigrants from Iraq (12.0%, a difference of 0.46%), and Spanish (12.0%, a difference of 0.50%).
DemographicsRating | RankReceiving Food Stamps
Peruvians
49.3
/100
|
#176
Average
11.7%
Immigrants | Ukraine
48.4
/100
|
#177
Average
11.8%
German Russians
48.1
/100
|
#178
Average
11.8%
Immigrants | Kenya
46.4
/100
|
#179
Average
11.8%
Uruguayans
44.8
/100
|
#180
Average
11.8%
South American Indians
41.7
/100
|
#181
Average
11.9%
Immigrants | Morocco
40.7
/100
|
#182
Average
11.9%
Immigrants | Uganda
40.3
/100
|
#183
Average
11.9%
Spaniards
39.8
/100
|
#184
Fair
11.9%
Immigrants | Iraq
37.1
/100
|
#185
Fair
12.0%
Spanish
36.9
/100
|
#186
Fair
12.0%
Albanians
35.4
/100
|
#187
Fair
12.0%
Sudanese
33.4
/100
|
#188
Fair
12.0%
Immigrants | Cameroon
32.5
/100
|
#189
Fair
12.0%
Immigrants | Peru
32.2
/100
|
#190
Fair
12.0%