Syrian vs Nonimmigrants Single Male Poverty
COMPARE
Syrian
Nonimmigrants
Single Male Poverty
Single Male Poverty Comparison
Syrians
Nonimmigrants
12.8%
SINGLE MALE POVERTY
48.4/ 100
METRIC RATING
176th/ 347
METRIC RANK
14.6%
SINGLE MALE POVERTY
0.0/ 100
METRIC RATING
292nd/ 347
METRIC RANK
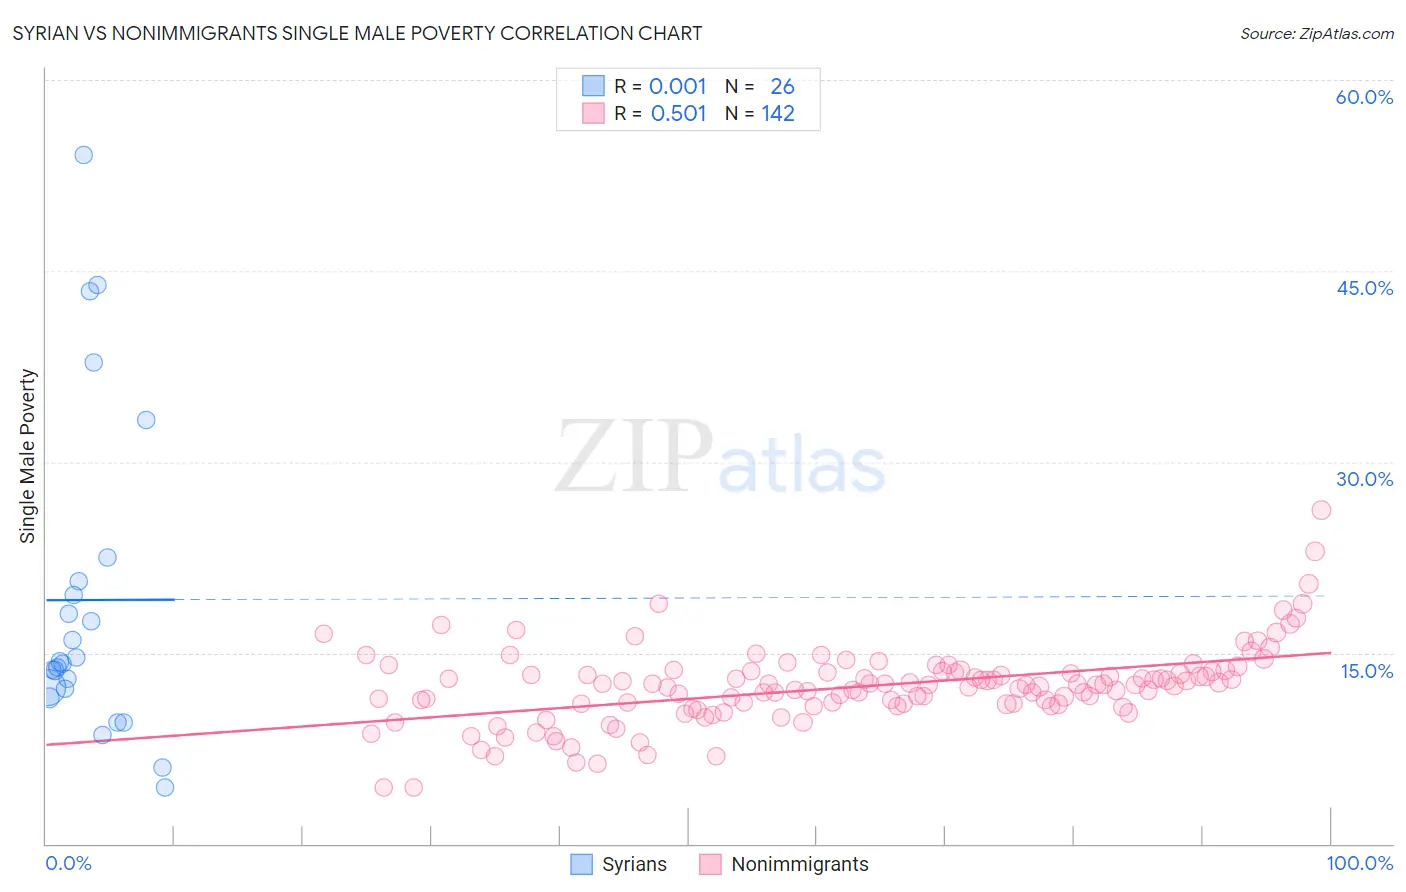
Syrian vs Nonimmigrants Single Male Poverty Correlation Chart
The statistical analysis conducted on geographies consisting of 240,186,917 people shows no correlation between the proportion of Syrians and poverty level among single males in the United States with a correlation coefficient (R) of 0.001 and weighted average of 12.8%. Similarly, the statistical analysis conducted on geographies consisting of 470,347,723 people shows a substantial positive correlation between the proportion of Nonimmigrants and poverty level among single males in the United States with a correlation coefficient (R) of 0.501 and weighted average of 14.6%, a difference of 13.8%.
Single Male Poverty Correlation Summary
| Measurement | Syrian | Nonimmigrants |
| Minimum | 4.4% | 4.4% |
| Maximum | 54.1% | 26.2% |
| Range | 49.7% | 21.8% |
| Mean | 19.1% | 12.4% |
| Median | 14.2% | 12.5% |
| Interquartile 25% (IQ1) | 12.2% | 11.0% |
| Interquartile 75% (IQ3) | 20.6% | 13.5% |
| Interquartile Range (IQR) | 8.5% | 2.5% |
| Standard Deviation (Sample) | 12.7% | 3.1% |
| Standard Deviation (Population) | 12.5% | 3.1% |
Similar Demographics by Single Male Poverty
Demographics Similar to Syrians by Single Male Poverty
In terms of single male poverty, the demographic groups most similar to Syrians are Croatian (12.8%, a difference of 0.020%), Costa Rican (12.8%, a difference of 0.080%), Immigrants from St. Vincent and the Grenadines (12.8%, a difference of 0.13%), South African (12.8%, a difference of 0.16%), and Danish (12.8%, a difference of 0.16%).
| Demographics | Rating | Rank | Single Male Poverty |
| Puget Sound Salish | 54.3 /100 | #169 | Average 12.8% |
| Guyanese | 52.0 /100 | #170 | Average 12.8% |
| South Africans | 51.5 /100 | #171 | Average 12.8% |
| Danes | 51.4 /100 | #172 | Average 12.8% |
| Immigrants | St. Vincent and the Grenadines | 50.9 /100 | #173 | Average 12.8% |
| Costa Ricans | 50.0 /100 | #174 | Average 12.8% |
| Croatians | 48.9 /100 | #175 | Average 12.8% |
| Syrians | 48.4 /100 | #176 | Average 12.8% |
| Immigrants | Canada | 44.8 /100 | #177 | Average 12.8% |
| Immigrants | Switzerland | 43.1 /100 | #178 | Average 12.8% |
| Israelis | 41.0 /100 | #179 | Average 12.9% |
| Immigrants | North America | 37.7 /100 | #180 | Fair 12.9% |
| Panamanians | 37.6 /100 | #181 | Fair 12.9% |
| Moroccans | 36.8 /100 | #182 | Fair 12.9% |
| Immigrants | West Indies | 33.0 /100 | #183 | Fair 12.9% |
Demographics Similar to Nonimmigrants by Single Male Poverty
In terms of single male poverty, the demographic groups most similar to Nonimmigrants are French Canadian (14.6%, a difference of 0.11%), Bahamian (14.6%, a difference of 0.13%), U.S. Virgin Islander (14.5%, a difference of 0.28%), Ottawa (14.6%, a difference of 0.30%), and Immigrants from Dominica (14.5%, a difference of 0.51%).
| Demographics | Rating | Rank | Single Male Poverty |
| French | 0.0 /100 | #285 | Tragic 14.4% |
| Celtics | 0.0 /100 | #286 | Tragic 14.5% |
| Iroquois | 0.0 /100 | #287 | Tragic 14.5% |
| Whites/Caucasians | 0.0 /100 | #288 | Tragic 14.5% |
| Immigrants | Dominica | 0.0 /100 | #289 | Tragic 14.5% |
| U.S. Virgin Islanders | 0.0 /100 | #290 | Tragic 14.5% |
| Bahamians | 0.0 /100 | #291 | Tragic 14.6% |
| Immigrants | Nonimmigrants | 0.0 /100 | #292 | Tragic 14.6% |
| French Canadians | 0.0 /100 | #293 | Tragic 14.6% |
| Ottawa | 0.0 /100 | #294 | Tragic 14.6% |
| Scotch-Irish | 0.0 /100 | #295 | Tragic 14.7% |
| Africans | 0.0 /100 | #296 | Tragic 14.7% |
| Immigrants | Dominican Republic | 0.0 /100 | #297 | Tragic 14.8% |
| French American Indians | 0.0 /100 | #298 | Tragic 15.0% |
| Delaware | 0.0 /100 | #299 | Tragic 15.0% |