Venezuelan vs Swedish Child Poverty Among Girls Under 16
COMPARE
Venezuelan
Swedish
Child Poverty Among Girls Under 16
Child Poverty Among Girls Under 16 Comparison
Venezuelans
Swedes
15.8%
CHILD POVERTY AMONG GIRLS UNDER 16
80.1/ 100
METRIC RATING
151st/ 347
METRIC RANK
13.7%
CHILD POVERTY AMONG GIRLS UNDER 16
99.7/ 100
METRIC RATING
33rd/ 347
METRIC RANK
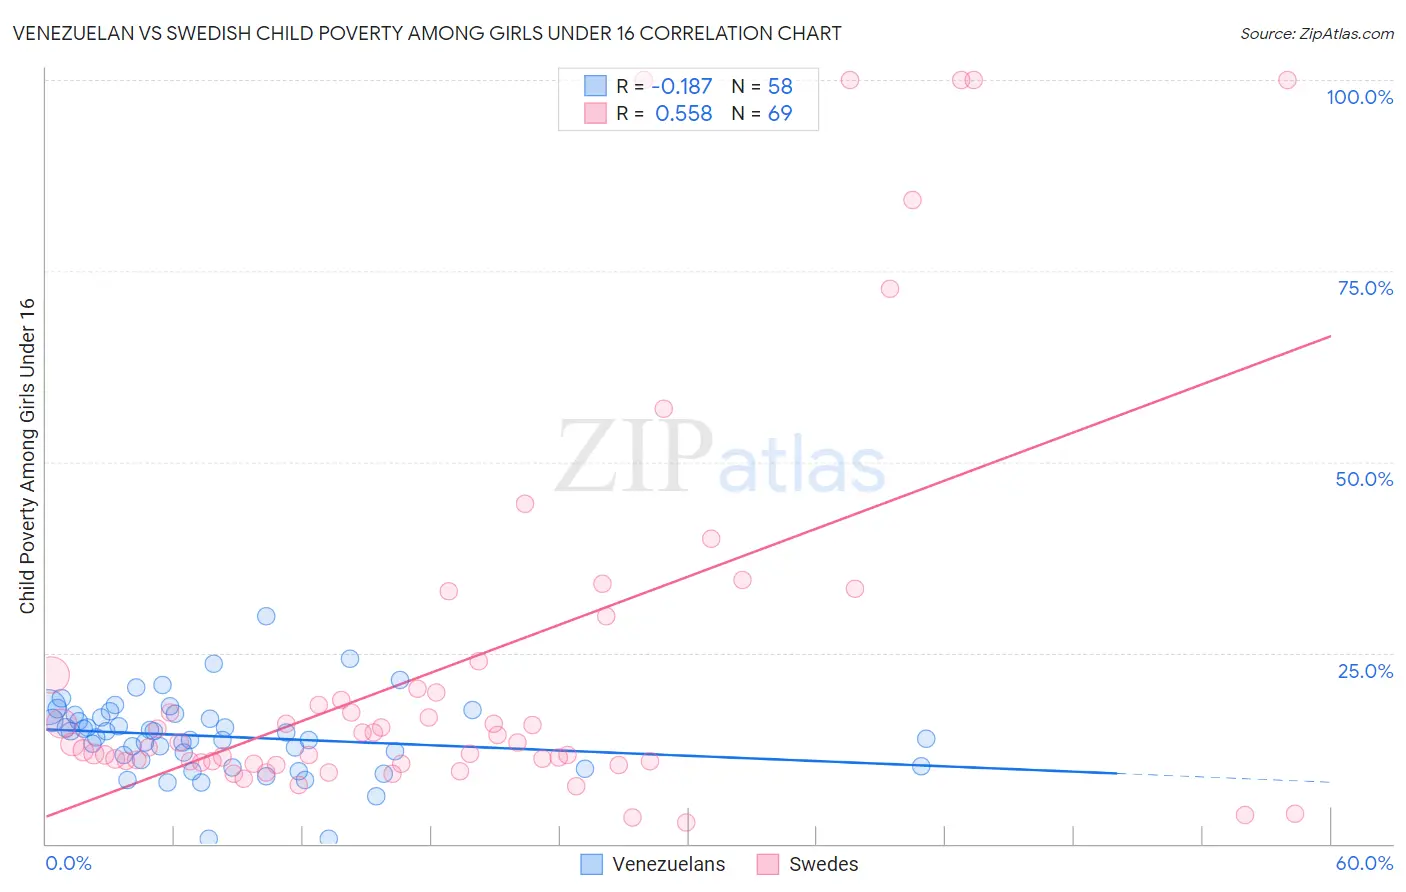
Venezuelan vs Swedish Child Poverty Among Girls Under 16 Correlation Chart
The statistical analysis conducted on geographies consisting of 302,424,022 people shows a poor negative correlation between the proportion of Venezuelans and poverty level among girls under the age of 16 in the United States with a correlation coefficient (R) of -0.187 and weighted average of 15.8%. Similarly, the statistical analysis conducted on geographies consisting of 519,531,416 people shows a substantial positive correlation between the proportion of Swedes and poverty level among girls under the age of 16 in the United States with a correlation coefficient (R) of 0.558 and weighted average of 13.7%, a difference of 15.4%.
Child Poverty Among Girls Under 16 Correlation Summary
| Measurement | Venezuelan | Swedish |
| Minimum | 0.62% | 2.7% |
| Maximum | 29.7% | 100.0% |
| Range | 29.1% | 97.3% |
| Mean | 14.0% | 23.7% |
| Median | 14.3% | 13.2% |
| Interquartile 25% (IQ1) | 10.9% | 10.7% |
| Interquartile 75% (IQ3) | 16.9% | 21.2% |
| Interquartile Range (IQR) | 5.9% | 10.4% |
| Standard Deviation (Sample) | 5.1% | 25.8% |
| Standard Deviation (Population) | 5.0% | 25.6% |
Similar Demographics by Child Poverty Among Girls Under 16
Demographics Similar to Venezuelans by Child Poverty Among Girls Under 16
In terms of child poverty among girls under 16, the demographic groups most similar to Venezuelans are Immigrants from Albania (15.8%, a difference of 0.10%), Immigrants from Hungary (15.8%, a difference of 0.14%), Immigrants from Kuwait (15.8%, a difference of 0.14%), Immigrants from Nepal (15.9%, a difference of 0.29%), and Icelander (15.7%, a difference of 0.46%).
| Demographics | Rating | Rank | Child Poverty Among Girls Under 16 |
| Israelis | 86.3 /100 | #144 | Excellent 15.6% |
| Welsh | 85.4 /100 | #145 | Excellent 15.6% |
| Samoans | 84.2 /100 | #146 | Excellent 15.7% |
| Slavs | 83.1 /100 | #147 | Excellent 15.7% |
| Icelanders | 82.4 /100 | #148 | Excellent 15.7% |
| Immigrants | Hungary | 80.9 /100 | #149 | Excellent 15.8% |
| Immigrants | Albania | 80.7 /100 | #150 | Excellent 15.8% |
| Venezuelans | 80.1 /100 | #151 | Excellent 15.8% |
| Immigrants | Kuwait | 79.4 /100 | #152 | Good 15.8% |
| Immigrants | Nepal | 78.5 /100 | #153 | Good 15.9% |
| Immigrants | Chile | 76.7 /100 | #154 | Good 15.9% |
| Syrians | 76.7 /100 | #155 | Good 15.9% |
| Immigrants | Fiji | 76.1 /100 | #156 | Good 15.9% |
| Colombians | 76.1 /100 | #157 | Good 15.9% |
| Guamanians/Chamorros | 75.3 /100 | #158 | Good 15.9% |
Demographics Similar to Swedes by Child Poverty Among Girls Under 16
In terms of child poverty among girls under 16, the demographic groups most similar to Swedes are Danish (13.7%, a difference of 0.030%), Maltese (13.7%, a difference of 0.050%), Turkish (13.7%, a difference of 0.070%), Asian (13.7%, a difference of 0.19%), and Bolivian (13.6%, a difference of 0.87%).
| Demographics | Rating | Rank | Child Poverty Among Girls Under 16 |
| Eastern Europeans | 99.8 /100 | #26 | Exceptional 13.5% |
| Latvians | 99.8 /100 | #27 | Exceptional 13.5% |
| Tongans | 99.8 /100 | #28 | Exceptional 13.6% |
| Bolivians | 99.8 /100 | #29 | Exceptional 13.6% |
| Asians | 99.7 /100 | #30 | Exceptional 13.7% |
| Turks | 99.7 /100 | #31 | Exceptional 13.7% |
| Danes | 99.7 /100 | #32 | Exceptional 13.7% |
| Swedes | 99.7 /100 | #33 | Exceptional 13.7% |
| Maltese | 99.7 /100 | #34 | Exceptional 13.7% |
| Immigrants | Northern Europe | 99.6 /100 | #35 | Exceptional 13.8% |
| Russians | 99.6 /100 | #36 | Exceptional 13.9% |
| Lithuanians | 99.6 /100 | #37 | Exceptional 13.9% |
| Immigrants | Moldova | 99.6 /100 | #38 | Exceptional 13.9% |
| Immigrants | Australia | 99.5 /100 | #39 | Exceptional 14.0% |
| Immigrants | Sri Lanka | 99.5 /100 | #40 | Exceptional 14.0% |