Venezuelan vs Colville Child Poverty Under the Age of 16
COMPARE
Venezuelan
Colville
Child Poverty Under the Age of 16
Child Poverty Under the Age of 16 Comparison
Venezuelans
Colville
15.6%
CHILD POVERTY UNDER THE AGE OF 16
77.4/ 100
METRIC RATING
153rd/ 347
METRIC RANK
23.0%
CHILD POVERTY UNDER THE AGE OF 16
0.0/ 100
METRIC RATING
328th/ 347
METRIC RANK
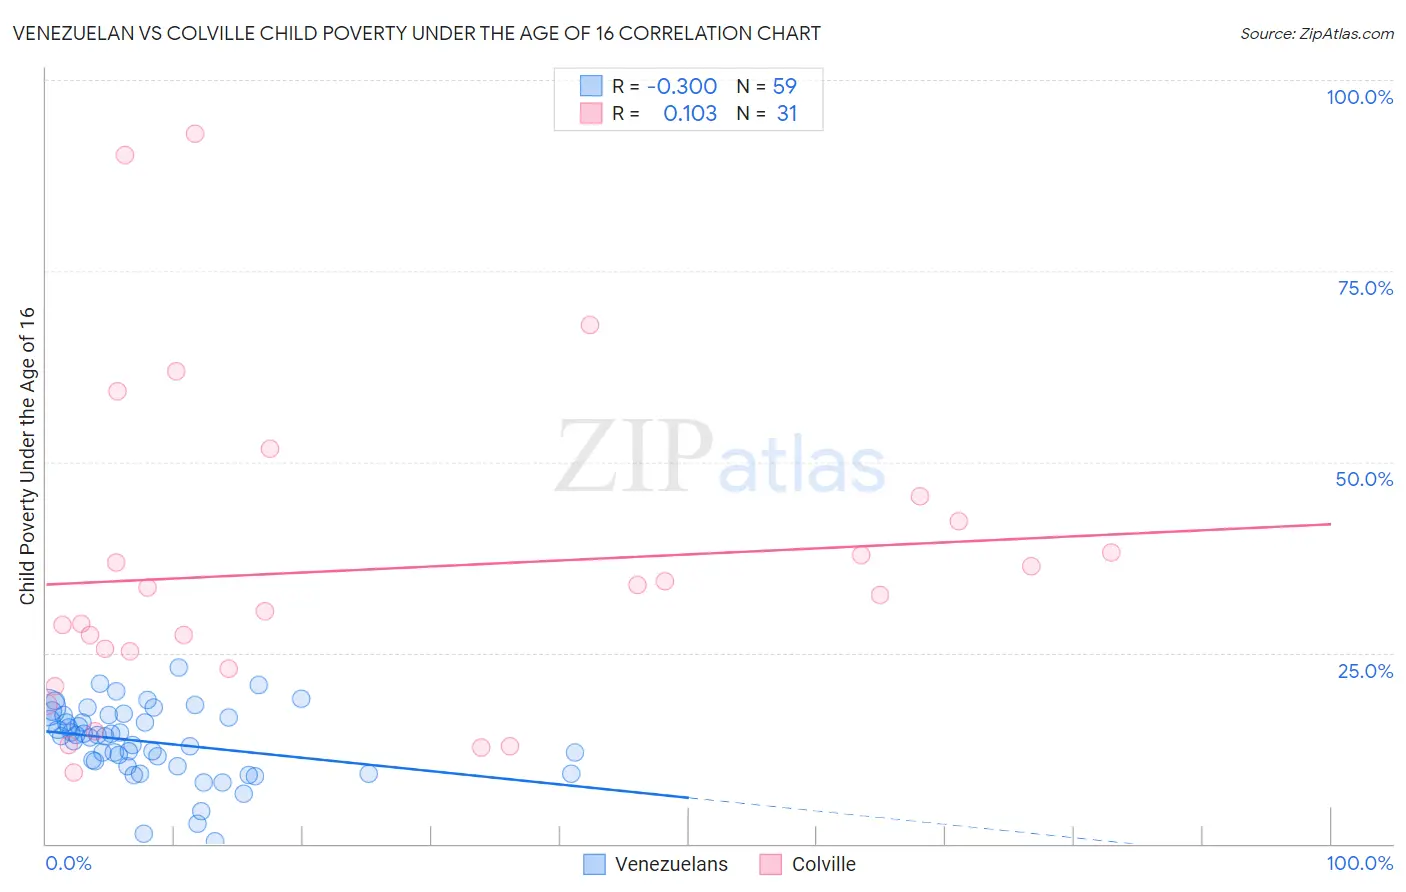
Venezuelan vs Colville Child Poverty Under the Age of 16 Correlation Chart
The statistical analysis conducted on geographies consisting of 304,499,680 people shows a weak negative correlation between the proportion of Venezuelans and poverty level among children under the age of 16 in the United States with a correlation coefficient (R) of -0.300 and weighted average of 15.6%. Similarly, the statistical analysis conducted on geographies consisting of 34,640,964 people shows a poor positive correlation between the proportion of Colville and poverty level among children under the age of 16 in the United States with a correlation coefficient (R) of 0.103 and weighted average of 23.0%, a difference of 47.7%.
Child Poverty Under the Age of 16 Correlation Summary
| Measurement | Venezuelan | Colville |
| Minimum | 0.32% | 9.3% |
| Maximum | 23.1% | 93.0% |
| Range | 22.8% | 83.7% |
| Mean | 13.3% | 35.9% |
| Median | 14.2% | 32.6% |
| Interquartile 25% (IQ1) | 10.1% | 23.0% |
| Interquartile 75% (IQ3) | 16.8% | 42.3% |
| Interquartile Range (IQR) | 6.7% | 19.3% |
| Standard Deviation (Sample) | 4.8% | 20.7% |
| Standard Deviation (Population) | 4.7% | 20.4% |
Similar Demographics by Child Poverty Under the Age of 16
Demographics Similar to Venezuelans by Child Poverty Under the Age of 16
In terms of child poverty under the age of 16, the demographic groups most similar to Venezuelans are Samoan (15.6%, a difference of 0.030%), French Canadian (15.6%, a difference of 0.15%), French (15.6%, a difference of 0.18%), Immigrants from Jordan (15.6%, a difference of 0.19%), and Syrian (15.6%, a difference of 0.24%).
| Demographics | Rating | Rank | Child Poverty Under the Age of 16 |
| Slovaks | 81.4 /100 | #146 | Excellent 15.5% |
| Immigrants | Kuwait | 80.5 /100 | #147 | Excellent 15.5% |
| Puget Sound Salish | 80.3 /100 | #148 | Excellent 15.5% |
| Israelis | 80.1 /100 | #149 | Excellent 15.5% |
| Immigrants | Jordan | 78.5 /100 | #150 | Good 15.6% |
| French | 78.5 /100 | #151 | Good 15.6% |
| French Canadians | 78.2 /100 | #152 | Good 15.6% |
| Venezuelans | 77.4 /100 | #153 | Good 15.6% |
| Samoans | 77.3 /100 | #154 | Good 15.6% |
| Syrians | 76.1 /100 | #155 | Good 15.6% |
| Immigrants | Venezuela | 74.9 /100 | #156 | Good 15.7% |
| Immigrants | Nepal | 72.9 /100 | #157 | Good 15.7% |
| Immigrants | Chile | 72.8 /100 | #158 | Good 15.7% |
| Immigrants | Fiji | 71.1 /100 | #159 | Good 15.8% |
| Immigrants | Albania | 70.7 /100 | #160 | Good 15.8% |
Demographics Similar to Colville by Child Poverty Under the Age of 16
In terms of child poverty under the age of 16, the demographic groups most similar to Colville are Menominee (23.0%, a difference of 0.38%), Immigrants from Honduras (22.7%, a difference of 1.5%), Immigrants from Congo (22.5%, a difference of 2.3%), Central American Indian (22.5%, a difference of 2.5%), and Paiute (22.4%, a difference of 2.8%).
| Demographics | Rating | Rank | Child Poverty Under the Age of 16 |
| Kiowa | 0.0 /100 | #321 | Tragic 22.2% |
| Hondurans | 0.0 /100 | #322 | Tragic 22.2% |
| Paiute | 0.0 /100 | #323 | Tragic 22.4% |
| Central American Indians | 0.0 /100 | #324 | Tragic 22.5% |
| Immigrants | Congo | 0.0 /100 | #325 | Tragic 22.5% |
| Immigrants | Honduras | 0.0 /100 | #326 | Tragic 22.7% |
| Menominee | 0.0 /100 | #327 | Tragic 23.0% |
| Colville | 0.0 /100 | #328 | Tragic 23.0% |
| Dominicans | 0.0 /100 | #329 | Tragic 23.8% |
| Natives/Alaskans | 0.0 /100 | #330 | Tragic 23.8% |
| Apache | 0.0 /100 | #331 | Tragic 23.8% |
| Pueblo | 0.0 /100 | #332 | Tragic 23.9% |
| Immigrants | Dominican Republic | 0.0 /100 | #333 | Tragic 24.0% |
| Blacks/African Americans | 0.0 /100 | #334 | Tragic 24.4% |
| Houma | 0.0 /100 | #335 | Tragic 24.9% |