Ute vs U.S. Virgin Islander Female Poverty Among 18-24 Year Olds
COMPARE
Ute
U.S. Virgin Islander
Female Poverty Among 18-24 Year Olds
Female Poverty Among 18-24 Year Olds Comparison
Ute
U.S. Virgin Islanders
25.4%
FEMALE POVERTY AMONG 18-24 YEAR OLDS
0.0/ 100
METRIC RATING
327th/ 347
METRIC RANK
22.5%
FEMALE POVERTY AMONG 18-24 YEAR OLDS
0.0/ 100
METRIC RATING
293rd/ 347
METRIC RANK
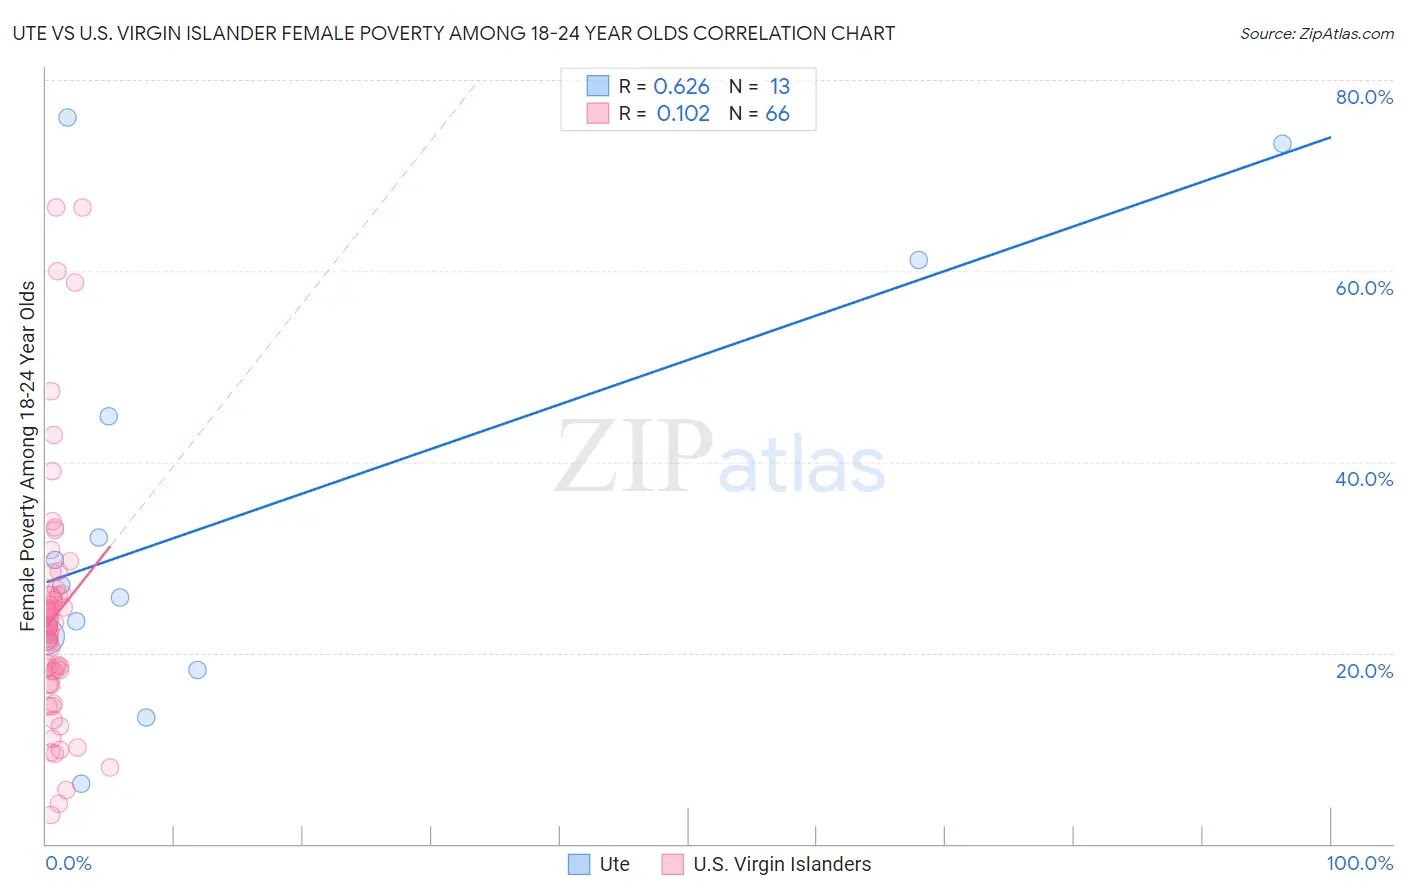
Ute vs U.S. Virgin Islander Female Poverty Among 18-24 Year Olds Correlation Chart
The statistical analysis conducted on geographies consisting of 55,446,169 people shows a significant positive correlation between the proportion of Ute and poverty level among females between the ages 18 and 24 in the United States with a correlation coefficient (R) of 0.626 and weighted average of 25.4%. Similarly, the statistical analysis conducted on geographies consisting of 87,095,394 people shows a poor positive correlation between the proportion of U.S. Virgin Islanders and poverty level among females between the ages 18 and 24 in the United States with a correlation coefficient (R) of 0.102 and weighted average of 22.5%, a difference of 13.0%.
Female Poverty Among 18-24 Year Olds Correlation Summary
| Measurement | Ute | U.S. Virgin Islander |
| Minimum | 6.2% | 3.0% |
| Maximum | 76.1% | 66.7% |
| Range | 69.9% | 63.6% |
| Mean | 34.8% | 23.8% |
| Median | 27.1% | 22.5% |
| Interquartile 25% (IQ1) | 19.9% | 16.8% |
| Interquartile 75% (IQ3) | 52.9% | 26.1% |
| Interquartile Range (IQR) | 33.0% | 9.3% |
| Standard Deviation (Sample) | 22.4% | 13.1% |
| Standard Deviation (Population) | 21.5% | 13.0% |
Similar Demographics by Female Poverty Among 18-24 Year Olds
Demographics Similar to Ute by Female Poverty Among 18-24 Year Olds
In terms of female poverty among 18-24 year olds, the demographic groups most similar to Ute are Native/Alaskan (25.4%, a difference of 0.050%), Yakama (25.3%, a difference of 0.23%), Immigrants from Saudi Arabia (25.3%, a difference of 0.48%), German Russian (25.2%, a difference of 0.91%), and Arapaho (25.2%, a difference of 0.94%).
| Demographics | Rating | Rank | Female Poverty Among 18-24 Year Olds |
| Immigrants | Congo | 0.0 /100 | #320 | Tragic 24.6% |
| Immigrants | Zaire | 0.0 /100 | #321 | Tragic 25.1% |
| Somalis | 0.0 /100 | #322 | Tragic 25.1% |
| Arapaho | 0.0 /100 | #323 | Tragic 25.2% |
| German Russians | 0.0 /100 | #324 | Tragic 25.2% |
| Immigrants | Saudi Arabia | 0.0 /100 | #325 | Tragic 25.3% |
| Yakama | 0.0 /100 | #326 | Tragic 25.3% |
| Ute | 0.0 /100 | #327 | Tragic 25.4% |
| Natives/Alaskans | 0.0 /100 | #328 | Tragic 25.4% |
| Cajuns | 0.0 /100 | #329 | Tragic 25.7% |
| Immigrants | Somalia | 0.0 /100 | #330 | Tragic 25.7% |
| Chippewa | 0.0 /100 | #331 | Tragic 25.9% |
| Houma | 0.0 /100 | #332 | Tragic 26.2% |
| Apache | 0.0 /100 | #333 | Tragic 26.3% |
| Pueblo | 0.0 /100 | #334 | Tragic 26.9% |
Demographics Similar to U.S. Virgin Islanders by Female Poverty Among 18-24 Year Olds
In terms of female poverty among 18-24 year olds, the demographic groups most similar to U.S. Virgin Islanders are Alaskan Athabascan (22.5%, a difference of 0.030%), Indonesian (22.5%, a difference of 0.030%), Bangladeshi (22.5%, a difference of 0.080%), Shoshone (22.5%, a difference of 0.16%), and Menominee (22.5%, a difference of 0.26%).
| Demographics | Rating | Rank | Female Poverty Among 18-24 Year Olds |
| Ugandans | 0.0 /100 | #286 | Tragic 22.1% |
| Immigrants | Middle Africa | 0.0 /100 | #287 | Tragic 22.1% |
| Dominicans | 0.0 /100 | #288 | Tragic 22.3% |
| French American Indians | 0.0 /100 | #289 | Tragic 22.3% |
| Immigrants | Senegal | 0.0 /100 | #290 | Tragic 22.4% |
| Bangladeshis | 0.0 /100 | #291 | Tragic 22.5% |
| Alaskan Athabascans | 0.0 /100 | #292 | Tragic 22.5% |
| U.S. Virgin Islanders | 0.0 /100 | #293 | Tragic 22.5% |
| Indonesians | 0.0 /100 | #294 | Tragic 22.5% |
| Shoshone | 0.0 /100 | #295 | Tragic 22.5% |
| Menominee | 0.0 /100 | #296 | Tragic 22.5% |
| Inupiat | 0.0 /100 | #297 | Tragic 22.6% |
| Central American Indians | 0.0 /100 | #298 | Tragic 22.6% |
| Cherokee | 0.0 /100 | #299 | Tragic 22.7% |
| Africans | 0.0 /100 | #300 | Tragic 22.8% |