European vs U.S. Virgin Islander Female Poverty Among 18-24 Year Olds
COMPARE
European
U.S. Virgin Islander
Female Poverty Among 18-24 Year Olds
Female Poverty Among 18-24 Year Olds Comparison
Europeans
U.S. Virgin Islanders
20.4%
FEMALE POVERTY AMONG 18-24 YEAR OLDS
19.9/ 100
METRIC RATING
200th/ 347
METRIC RANK
22.5%
FEMALE POVERTY AMONG 18-24 YEAR OLDS
0.0/ 100
METRIC RATING
293rd/ 347
METRIC RANK
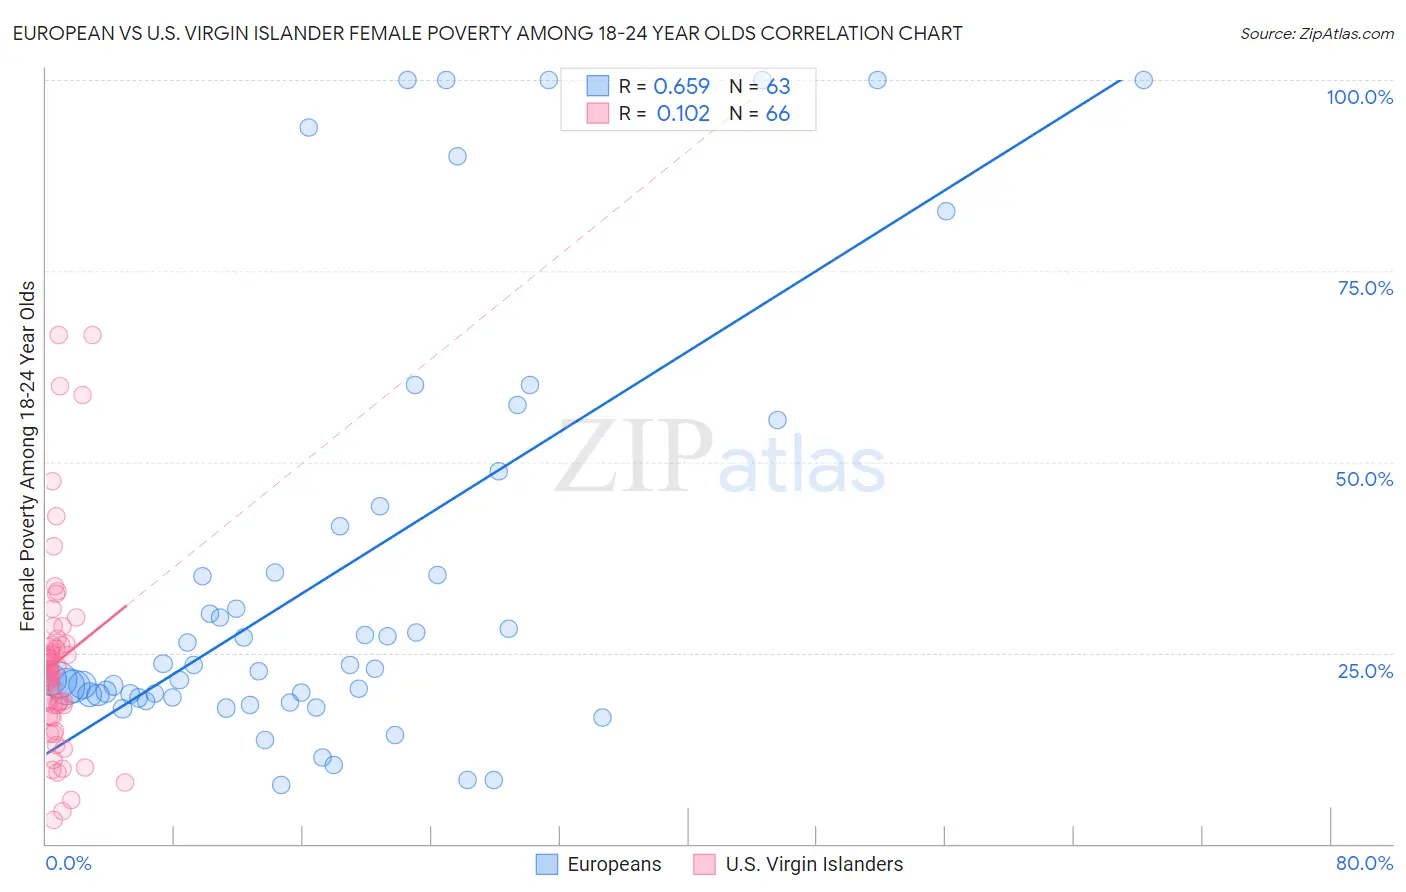
European vs U.S. Virgin Islander Female Poverty Among 18-24 Year Olds Correlation Chart
The statistical analysis conducted on geographies consisting of 530,028,341 people shows a significant positive correlation between the proportion of Europeans and poverty level among females between the ages 18 and 24 in the United States with a correlation coefficient (R) of 0.659 and weighted average of 20.4%. Similarly, the statistical analysis conducted on geographies consisting of 87,095,394 people shows a poor positive correlation between the proportion of U.S. Virgin Islanders and poverty level among females between the ages 18 and 24 in the United States with a correlation coefficient (R) of 0.102 and weighted average of 22.5%, a difference of 10.0%.
Female Poverty Among 18-24 Year Olds Correlation Summary
| Measurement | European | U.S. Virgin Islander |
| Minimum | 7.7% | 3.0% |
| Maximum | 100.0% | 66.7% |
| Range | 92.3% | 63.6% |
| Mean | 35.4% | 23.8% |
| Median | 22.9% | 22.5% |
| Interquartile 25% (IQ1) | 19.2% | 16.8% |
| Interquartile 75% (IQ3) | 41.6% | 26.1% |
| Interquartile Range (IQR) | 22.4% | 9.3% |
| Standard Deviation (Sample) | 27.7% | 13.1% |
| Standard Deviation (Population) | 27.5% | 13.0% |
Similar Demographics by Female Poverty Among 18-24 Year Olds
Demographics Similar to Europeans by Female Poverty Among 18-24 Year Olds
In terms of female poverty among 18-24 year olds, the demographic groups most similar to Europeans are German (20.4%, a difference of 0.050%), Immigrants from Spain (20.4%, a difference of 0.060%), Zimbabwean (20.4%, a difference of 0.080%), Mexican (20.5%, a difference of 0.13%), and Czech (20.4%, a difference of 0.17%).
| Demographics | Rating | Rank | Female Poverty Among 18-24 Year Olds |
| Nigerians | 23.4 /100 | #193 | Fair 20.4% |
| Mexican American Indians | 23.2 /100 | #194 | Fair 20.4% |
| Immigrants | Latvia | 23.0 /100 | #195 | Fair 20.4% |
| Czechs | 22.3 /100 | #196 | Fair 20.4% |
| Zimbabweans | 21.0 /100 | #197 | Fair 20.4% |
| Immigrants | Spain | 20.7 /100 | #198 | Fair 20.4% |
| Germans | 20.6 /100 | #199 | Fair 20.4% |
| Europeans | 19.9 /100 | #200 | Poor 20.4% |
| Mexicans | 18.3 /100 | #201 | Poor 20.5% |
| Immigrants | Turkey | 17.7 /100 | #202 | Poor 20.5% |
| Immigrants | Malaysia | 17.2 /100 | #203 | Poor 20.5% |
| Immigrants | Netherlands | 17.0 /100 | #204 | Poor 20.5% |
| English | 16.7 /100 | #205 | Poor 20.5% |
| Hispanics or Latinos | 16.6 /100 | #206 | Poor 20.5% |
| Spaniards | 16.3 /100 | #207 | Poor 20.5% |
Demographics Similar to U.S. Virgin Islanders by Female Poverty Among 18-24 Year Olds
In terms of female poverty among 18-24 year olds, the demographic groups most similar to U.S. Virgin Islanders are Alaskan Athabascan (22.5%, a difference of 0.030%), Indonesian (22.5%, a difference of 0.030%), Bangladeshi (22.5%, a difference of 0.080%), Shoshone (22.5%, a difference of 0.16%), and Menominee (22.5%, a difference of 0.26%).
| Demographics | Rating | Rank | Female Poverty Among 18-24 Year Olds |
| Ugandans | 0.0 /100 | #286 | Tragic 22.1% |
| Immigrants | Middle Africa | 0.0 /100 | #287 | Tragic 22.1% |
| Dominicans | 0.0 /100 | #288 | Tragic 22.3% |
| French American Indians | 0.0 /100 | #289 | Tragic 22.3% |
| Immigrants | Senegal | 0.0 /100 | #290 | Tragic 22.4% |
| Bangladeshis | 0.0 /100 | #291 | Tragic 22.5% |
| Alaskan Athabascans | 0.0 /100 | #292 | Tragic 22.5% |
| U.S. Virgin Islanders | 0.0 /100 | #293 | Tragic 22.5% |
| Indonesians | 0.0 /100 | #294 | Tragic 22.5% |
| Shoshone | 0.0 /100 | #295 | Tragic 22.5% |
| Menominee | 0.0 /100 | #296 | Tragic 22.5% |
| Inupiat | 0.0 /100 | #297 | Tragic 22.6% |
| Central American Indians | 0.0 /100 | #298 | Tragic 22.6% |
| Cherokee | 0.0 /100 | #299 | Tragic 22.7% |
| Africans | 0.0 /100 | #300 | Tragic 22.8% |