Immigrants from Eastern Africa vs U.S. Virgin Islander Female Poverty Among 18-24 Year Olds
COMPARE
Immigrants from Eastern Africa
U.S. Virgin Islander
Female Poverty Among 18-24 Year Olds
Female Poverty Among 18-24 Year Olds Comparison
Immigrants from Eastern Africa
U.S. Virgin Islanders
21.4%
FEMALE POVERTY AMONG 18-24 YEAR OLDS
0.4/ 100
METRIC RATING
262nd/ 347
METRIC RANK
22.5%
FEMALE POVERTY AMONG 18-24 YEAR OLDS
0.0/ 100
METRIC RATING
293rd/ 347
METRIC RANK
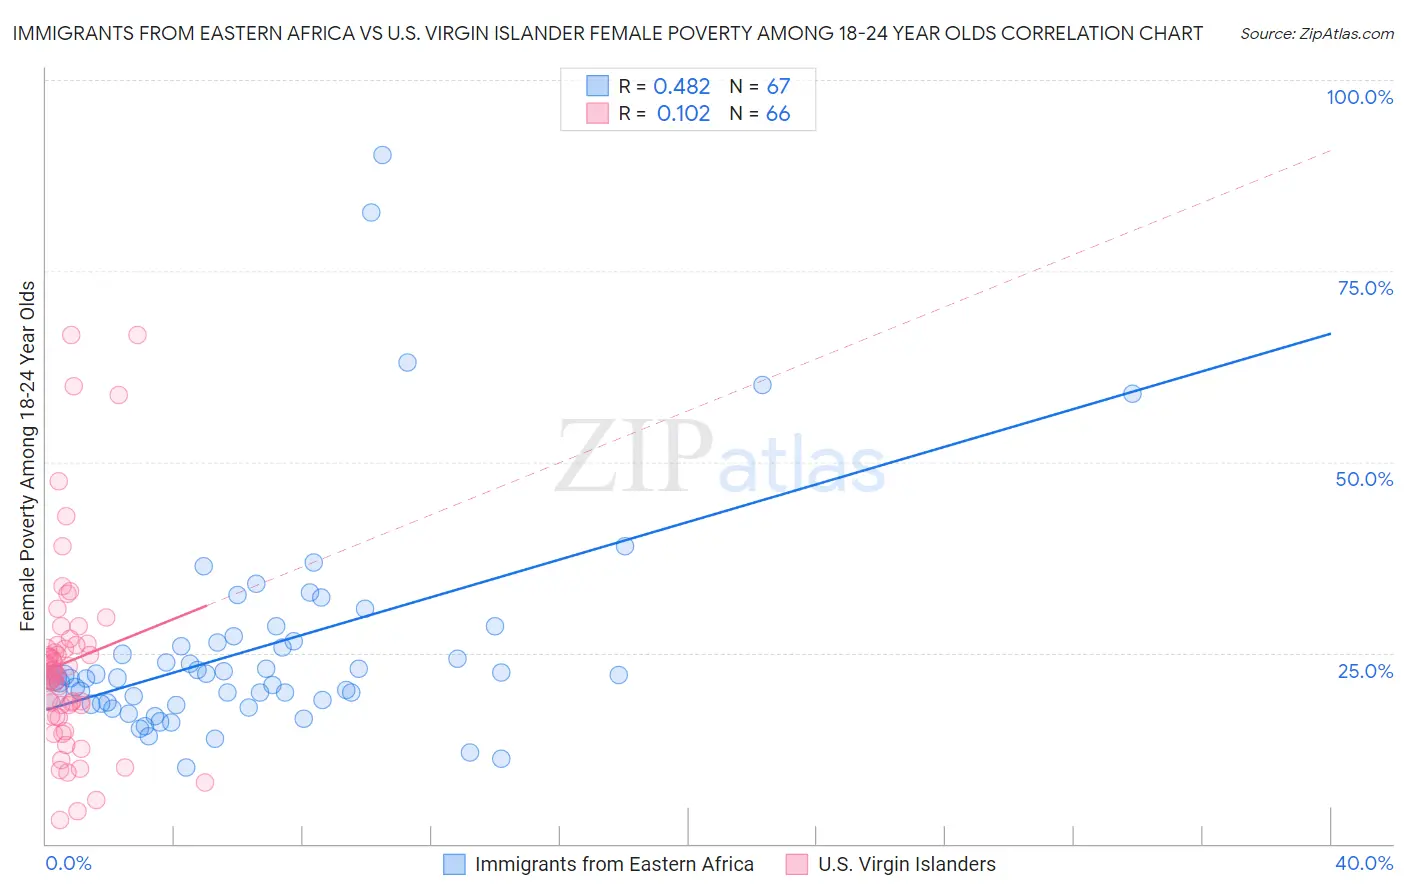
Immigrants from Eastern Africa vs U.S. Virgin Islander Female Poverty Among 18-24 Year Olds Correlation Chart
The statistical analysis conducted on geographies consisting of 348,760,216 people shows a moderate positive correlation between the proportion of Immigrants from Eastern Africa and poverty level among females between the ages 18 and 24 in the United States with a correlation coefficient (R) of 0.482 and weighted average of 21.4%. Similarly, the statistical analysis conducted on geographies consisting of 87,095,394 people shows a poor positive correlation between the proportion of U.S. Virgin Islanders and poverty level among females between the ages 18 and 24 in the United States with a correlation coefficient (R) of 0.102 and weighted average of 22.5%, a difference of 4.9%.
Female Poverty Among 18-24 Year Olds Correlation Summary
| Measurement | Immigrants from Eastern Africa | U.S. Virgin Islander |
| Minimum | 10.0% | 3.0% |
| Maximum | 90.2% | 66.7% |
| Range | 80.3% | 63.6% |
| Mean | 25.8% | 23.8% |
| Median | 21.8% | 22.5% |
| Interquartile 25% (IQ1) | 18.4% | 16.8% |
| Interquartile 75% (IQ3) | 26.5% | 26.1% |
| Interquartile Range (IQR) | 8.1% | 9.3% |
| Standard Deviation (Sample) | 14.7% | 13.1% |
| Standard Deviation (Population) | 14.6% | 13.0% |
Similar Demographics by Female Poverty Among 18-24 Year Olds
Demographics Similar to Immigrants from Eastern Africa by Female Poverty Among 18-24 Year Olds
In terms of female poverty among 18-24 year olds, the demographic groups most similar to Immigrants from Eastern Africa are Immigrants from Bahamas (21.4%, a difference of 0.20%), Immigrants from Norway (21.4%, a difference of 0.26%), Immigrants from France (21.4%, a difference of 0.31%), Vietnamese (21.4%, a difference of 0.34%), and Icelander (21.5%, a difference of 0.35%).
| Demographics | Rating | Rank | Female Poverty Among 18-24 Year Olds |
| Immigrants | Grenada | 1.2 /100 | #255 | Tragic 21.2% |
| Tsimshian | 1.0 /100 | #256 | Tragic 21.2% |
| Taiwanese | 1.0 /100 | #257 | Tragic 21.2% |
| Vietnamese | 0.6 /100 | #258 | Tragic 21.4% |
| Immigrants | France | 0.6 /100 | #259 | Tragic 21.4% |
| Immigrants | Norway | 0.6 /100 | #260 | Tragic 21.4% |
| Immigrants | Bahamas | 0.5 /100 | #261 | Tragic 21.4% |
| Immigrants | Eastern Africa | 0.4 /100 | #262 | Tragic 21.4% |
| Icelanders | 0.3 /100 | #263 | Tragic 21.5% |
| Hondurans | 0.3 /100 | #264 | Tragic 21.5% |
| Immigrants | Nonimmigrants | 0.3 /100 | #265 | Tragic 21.5% |
| Alaska Natives | 0.3 /100 | #266 | Tragic 21.5% |
| Americans | 0.3 /100 | #267 | Tragic 21.6% |
| Immigrants | Burma/Myanmar | 0.2 /100 | #268 | Tragic 21.6% |
| Celtics | 0.2 /100 | #269 | Tragic 21.6% |
Demographics Similar to U.S. Virgin Islanders by Female Poverty Among 18-24 Year Olds
In terms of female poverty among 18-24 year olds, the demographic groups most similar to U.S. Virgin Islanders are Alaskan Athabascan (22.5%, a difference of 0.030%), Indonesian (22.5%, a difference of 0.030%), Bangladeshi (22.5%, a difference of 0.080%), Shoshone (22.5%, a difference of 0.16%), and Menominee (22.5%, a difference of 0.26%).
| Demographics | Rating | Rank | Female Poverty Among 18-24 Year Olds |
| Ugandans | 0.0 /100 | #286 | Tragic 22.1% |
| Immigrants | Middle Africa | 0.0 /100 | #287 | Tragic 22.1% |
| Dominicans | 0.0 /100 | #288 | Tragic 22.3% |
| French American Indians | 0.0 /100 | #289 | Tragic 22.3% |
| Immigrants | Senegal | 0.0 /100 | #290 | Tragic 22.4% |
| Bangladeshis | 0.0 /100 | #291 | Tragic 22.5% |
| Alaskan Athabascans | 0.0 /100 | #292 | Tragic 22.5% |
| U.S. Virgin Islanders | 0.0 /100 | #293 | Tragic 22.5% |
| Indonesians | 0.0 /100 | #294 | Tragic 22.5% |
| Shoshone | 0.0 /100 | #295 | Tragic 22.5% |
| Menominee | 0.0 /100 | #296 | Tragic 22.5% |
| Inupiat | 0.0 /100 | #297 | Tragic 22.6% |
| Central American Indians | 0.0 /100 | #298 | Tragic 22.6% |
| Cherokee | 0.0 /100 | #299 | Tragic 22.7% |
| Africans | 0.0 /100 | #300 | Tragic 22.8% |