Ute vs Immigrants from Uganda Child Poverty Under the Age of 5
COMPARE
Ute
Immigrants from Uganda
Child Poverty Under the Age of 5
Child Poverty Under the Age of 5 Comparison
Ute
Immigrants from Uganda
23.5%
CHILD POVERTY UNDER THE AGE OF 5
0.0/ 100
METRIC RATING
322nd/ 347
METRIC RANK
17.7%
CHILD POVERTY UNDER THE AGE OF 5
25.0/ 100
METRIC RATING
193rd/ 347
METRIC RANK
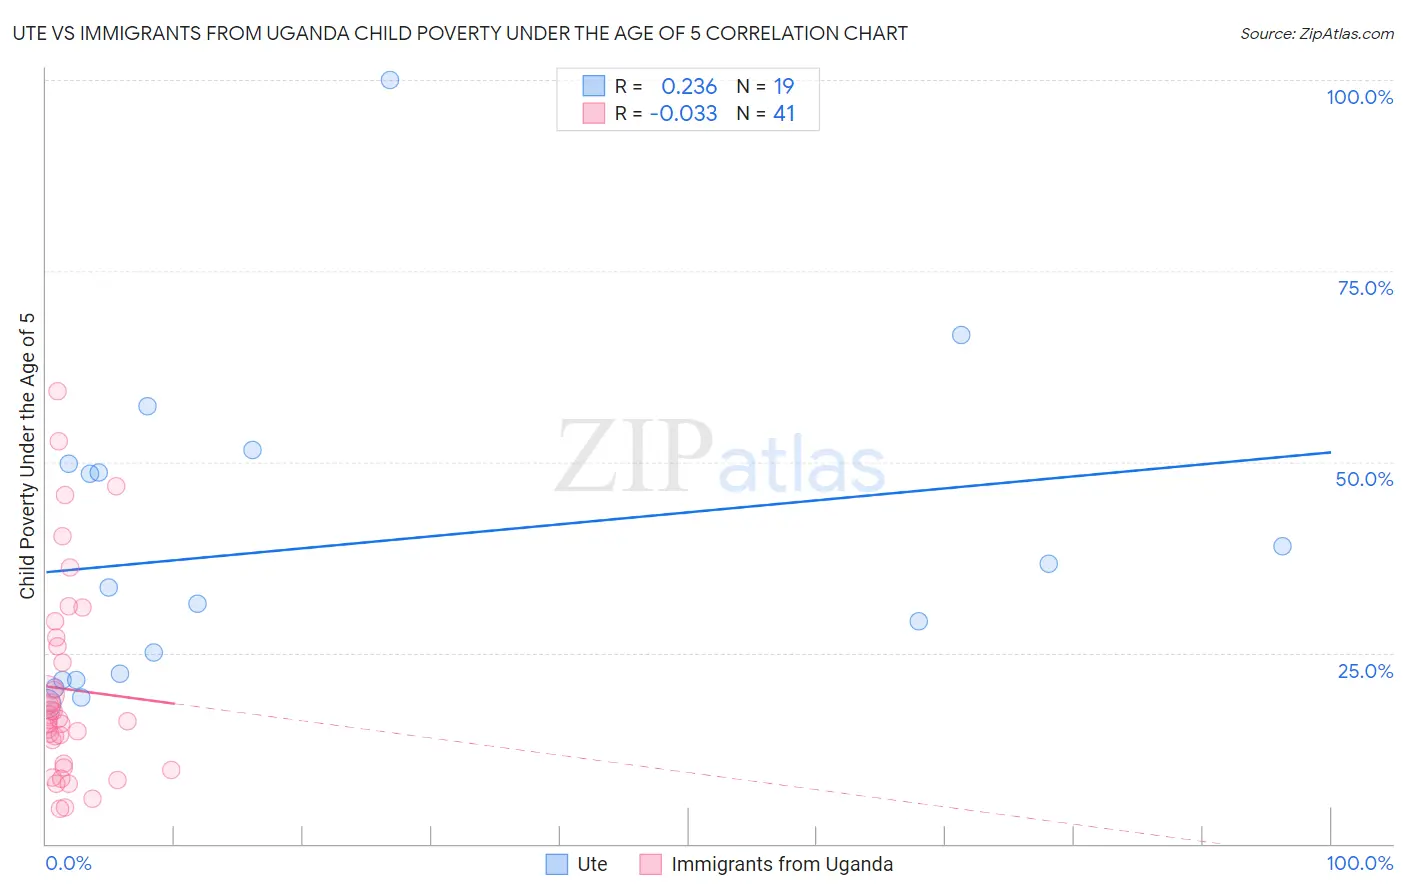
Ute vs Immigrants from Uganda Child Poverty Under the Age of 5 Correlation Chart
The statistical analysis conducted on geographies consisting of 55,277,980 people shows a weak positive correlation between the proportion of Ute and poverty level among children under the age of 5 in the United States with a correlation coefficient (R) of 0.236 and weighted average of 23.5%. Similarly, the statistical analysis conducted on geographies consisting of 124,022,230 people shows no correlation between the proportion of Immigrants from Uganda and poverty level among children under the age of 5 in the United States with a correlation coefficient (R) of -0.033 and weighted average of 17.7%, a difference of 32.9%.
Child Poverty Under the Age of 5 Correlation Summary
| Measurement | Ute | Immigrants from Uganda |
| Minimum | 18.4% | 4.6% |
| Maximum | 100.0% | 59.2% |
| Range | 81.6% | 54.6% |
| Mean | 38.9% | 20.2% |
| Median | 33.5% | 16.2% |
| Interquartile 25% (IQ1) | 21.4% | 10.2% |
| Interquartile 75% (IQ3) | 49.7% | 26.4% |
| Interquartile Range (IQR) | 28.3% | 16.1% |
| Standard Deviation (Sample) | 20.7% | 13.3% |
| Standard Deviation (Population) | 20.2% | 13.1% |
Similar Demographics by Child Poverty Under the Age of 5
Demographics Similar to Ute by Child Poverty Under the Age of 5
In terms of child poverty under the age of 5, the demographic groups most similar to Ute are Immigrants from Honduras (23.5%, a difference of 0.23%), Choctaw (23.5%, a difference of 0.26%), Pueblo (23.7%, a difference of 0.58%), Chippewa (23.4%, a difference of 0.64%), and Dutch West Indian (23.3%, a difference of 1.1%).
| Demographics | Rating | Rank | Child Poverty Under the Age of 5 |
| Arapaho | 0.0 /100 | #315 | Tragic 23.1% |
| Yakama | 0.0 /100 | #316 | Tragic 23.1% |
| Menominee | 0.0 /100 | #317 | Tragic 23.3% |
| Dutch West Indians | 0.0 /100 | #318 | Tragic 23.3% |
| Chippewa | 0.0 /100 | #319 | Tragic 23.4% |
| Choctaw | 0.0 /100 | #320 | Tragic 23.5% |
| Immigrants | Honduras | 0.0 /100 | #321 | Tragic 23.5% |
| Ute | 0.0 /100 | #322 | Tragic 23.5% |
| Pueblo | 0.0 /100 | #323 | Tragic 23.7% |
| Paiute | 0.0 /100 | #324 | Tragic 23.8% |
| Immigrants | Congo | 0.0 /100 | #325 | Tragic 23.9% |
| Central American Indians | 0.0 /100 | #326 | Tragic 23.9% |
| Dominicans | 0.0 /100 | #327 | Tragic 24.0% |
| Immigrants | Dominican Republic | 0.0 /100 | #328 | Tragic 24.1% |
| Cajuns | 0.0 /100 | #329 | Tragic 24.1% |
Demographics Similar to Immigrants from Uganda by Child Poverty Under the Age of 5
In terms of child poverty under the age of 5, the demographic groups most similar to Immigrants from Uganda are French Canadian (17.7%, a difference of 0.060%), Sierra Leonean (17.7%, a difference of 0.12%), Immigrants from Afghanistan (17.7%, a difference of 0.37%), Immigrants from Uruguay (17.7%, a difference of 0.37%), and Immigrants from Portugal (17.8%, a difference of 0.39%).
| Demographics | Rating | Rank | Child Poverty Under the Age of 5 |
| Immigrants | Bosnia and Herzegovina | 35.0 /100 | #186 | Fair 17.5% |
| Kenyans | 34.7 /100 | #187 | Fair 17.5% |
| Carpatho Rusyns | 33.6 /100 | #188 | Fair 17.5% |
| French | 33.6 /100 | #189 | Fair 17.5% |
| Slovaks | 29.2 /100 | #190 | Fair 17.6% |
| Immigrants | Afghanistan | 27.9 /100 | #191 | Fair 17.7% |
| Immigrants | Uruguay | 27.8 /100 | #192 | Fair 17.7% |
| Immigrants | Uganda | 25.0 /100 | #193 | Fair 17.7% |
| French Canadians | 24.6 /100 | #194 | Fair 17.7% |
| Sierra Leoneans | 24.1 /100 | #195 | Fair 17.7% |
| Immigrants | Portugal | 22.2 /100 | #196 | Fair 17.8% |
| Immigrants | Kenya | 20.0 /100 | #197 | Fair 17.9% |
| Celtics | 18.3 /100 | #198 | Poor 17.9% |
| Hungarians | 18.3 /100 | #199 | Poor 17.9% |
| Iraqis | 14.0 /100 | #200 | Poor 18.0% |