U.S. Virgin Islander vs Native/Alaskan Female Poverty Among 25-34 Year Olds
COMPARE
U.S. Virgin Islander
Native/Alaskan
Female Poverty Among 25-34 Year Olds
Female Poverty Among 25-34 Year Olds Comparison
U.S. Virgin Islanders
Natives/Alaskans
16.7%
FEMALE POVERTY AMONG 25-34 YEAR OLDS
0.0/ 100
METRIC RATING
300th/ 347
METRIC RANK
20.3%
FEMALE POVERTY AMONG 25-34 YEAR OLDS
0.0/ 100
METRIC RATING
335th/ 347
METRIC RANK
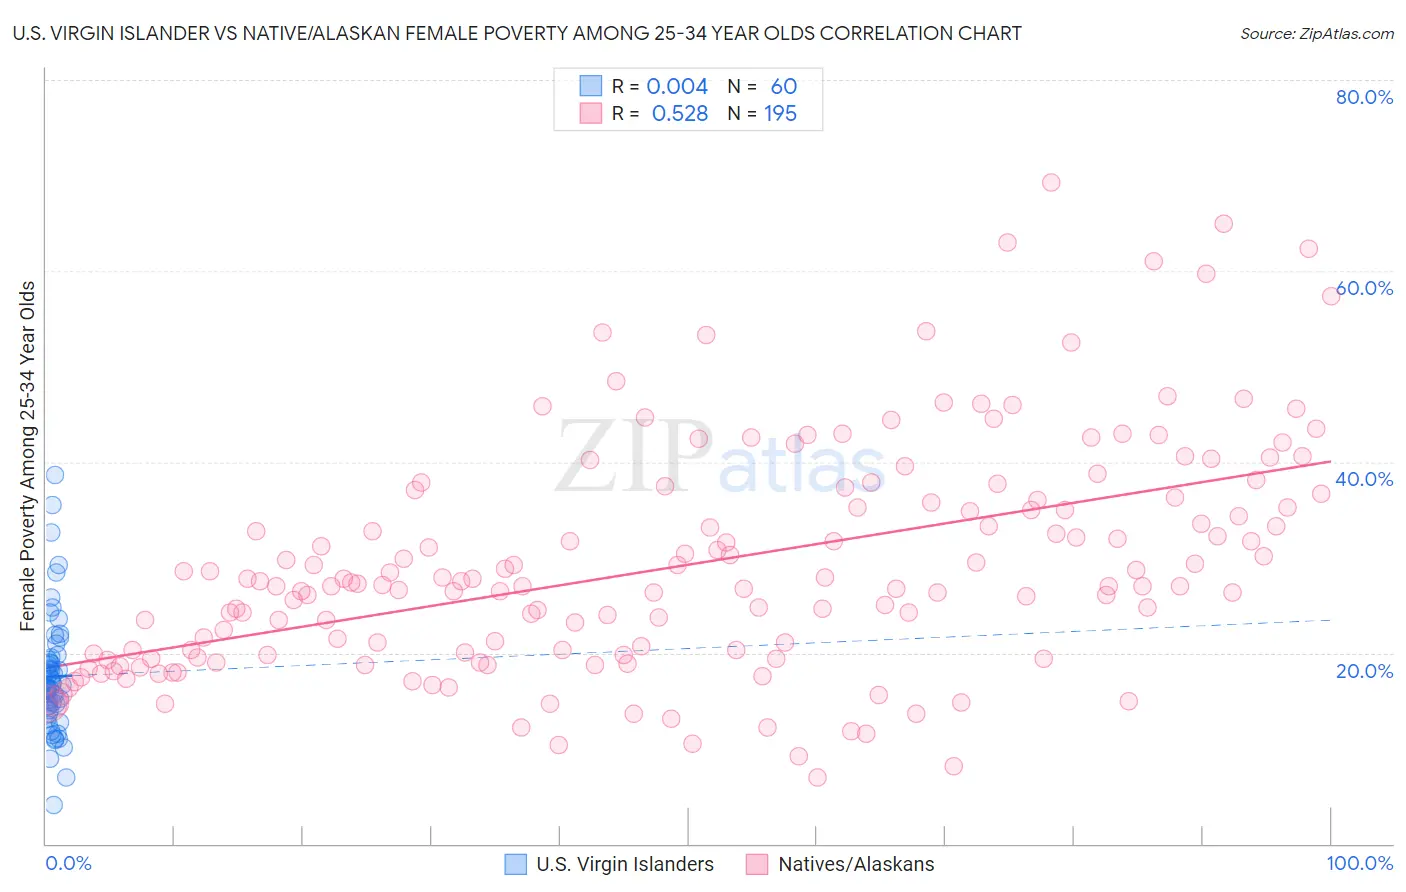
U.S. Virgin Islander vs Native/Alaskan Female Poverty Among 25-34 Year Olds Correlation Chart
The statistical analysis conducted on geographies consisting of 87,236,206 people shows no correlation between the proportion of U.S. Virgin Islanders and poverty level among females between the ages 25 and 34 in the United States with a correlation coefficient (R) of 0.004 and weighted average of 16.7%. Similarly, the statistical analysis conducted on geographies consisting of 501,642,469 people shows a substantial positive correlation between the proportion of Natives/Alaskans and poverty level among females between the ages 25 and 34 in the United States with a correlation coefficient (R) of 0.528 and weighted average of 20.3%, a difference of 21.2%.
Female Poverty Among 25-34 Year Olds Correlation Summary
| Measurement | U.S. Virgin Islander | Native/Alaskan |
| Minimum | 4.1% | 6.9% |
| Maximum | 38.7% | 69.3% |
| Range | 34.6% | 62.4% |
| Mean | 17.5% | 29.2% |
| Median | 16.3% | 27.1% |
| Interquartile 25% (IQ1) | 14.2% | 19.8% |
| Interquartile 75% (IQ3) | 19.4% | 36.0% |
| Interquartile Range (IQR) | 5.2% | 16.2% |
| Standard Deviation (Sample) | 6.3% | 11.9% |
| Standard Deviation (Population) | 6.3% | 11.9% |
Similar Demographics by Female Poverty Among 25-34 Year Olds
Demographics Similar to U.S. Virgin Islanders by Female Poverty Among 25-34 Year Olds
In terms of female poverty among 25-34 year olds, the demographic groups most similar to U.S. Virgin Islanders are Immigrants from Congo (16.7%, a difference of 0.010%), Alaska Native (16.8%, a difference of 0.12%), Spanish American (16.7%, a difference of 0.15%), Blackfeet (16.7%, a difference of 0.19%), and Immigrants from Mexico (16.8%, a difference of 0.44%).
| Demographics | Rating | Rank | Female Poverty Among 25-34 Year Olds |
| Potawatomi | 0.0 /100 | #293 | Tragic 16.5% |
| Immigrants | Central America | 0.0 /100 | #294 | Tragic 16.6% |
| Mexicans | 0.0 /100 | #295 | Tragic 16.6% |
| Hispanics or Latinos | 0.0 /100 | #296 | Tragic 16.6% |
| Immigrants | Guatemala | 0.0 /100 | #297 | Tragic 16.6% |
| Blackfeet | 0.0 /100 | #298 | Tragic 16.7% |
| Spanish Americans | 0.0 /100 | #299 | Tragic 16.7% |
| U.S. Virgin Islanders | 0.0 /100 | #300 | Tragic 16.7% |
| Immigrants | Congo | 0.0 /100 | #301 | Tragic 16.7% |
| Alaska Natives | 0.0 /100 | #302 | Tragic 16.8% |
| Immigrants | Mexico | 0.0 /100 | #303 | Tragic 16.8% |
| Hondurans | 0.0 /100 | #304 | Tragic 16.9% |
| Immigrants | Cabo Verde | 0.0 /100 | #305 | Tragic 16.9% |
| Chickasaw | 0.0 /100 | #306 | Tragic 17.0% |
| Yaqui | 0.0 /100 | #307 | Tragic 17.0% |
Demographics Similar to Natives/Alaskans by Female Poverty Among 25-34 Year Olds
In terms of female poverty among 25-34 year olds, the demographic groups most similar to Natives/Alaskans are Apache (20.1%, a difference of 1.1%), Cajun (19.9%, a difference of 1.8%), Immigrants from Yemen (19.8%, a difference of 2.6%), Kiowa (19.7%, a difference of 3.2%), and Paiute (19.6%, a difference of 3.6%).
| Demographics | Rating | Rank | Female Poverty Among 25-34 Year Olds |
| Alaskan Athabascans | 0.0 /100 | #328 | Tragic 19.1% |
| Creek | 0.0 /100 | #329 | Tragic 19.2% |
| Paiute | 0.0 /100 | #330 | Tragic 19.6% |
| Kiowa | 0.0 /100 | #331 | Tragic 19.7% |
| Immigrants | Yemen | 0.0 /100 | #332 | Tragic 19.8% |
| Cajuns | 0.0 /100 | #333 | Tragic 19.9% |
| Apache | 0.0 /100 | #334 | Tragic 20.1% |
| Natives/Alaskans | 0.0 /100 | #335 | Tragic 20.3% |
| Pueblo | 0.0 /100 | #336 | Tragic 22.2% |
| Crow | 0.0 /100 | #337 | Tragic 22.7% |
| Houma | 0.0 /100 | #338 | Tragic 22.7% |
| Yuman | 0.0 /100 | #339 | Tragic 22.9% |
| Sioux | 0.0 /100 | #340 | Tragic 23.0% |
| Navajo | 0.0 /100 | #341 | Tragic 23.3% |
| Hopi | 0.0 /100 | #342 | Tragic 23.7% |