U.S. Virgin Islander vs Immigrants from Liberia Female Poverty Among 25-34 Year Olds
COMPARE
U.S. Virgin Islander
Immigrants from Liberia
Female Poverty Among 25-34 Year Olds
Female Poverty Among 25-34 Year Olds Comparison
U.S. Virgin Islanders
Immigrants from Liberia
16.7%
FEMALE POVERTY AMONG 25-34 YEAR OLDS
0.0/ 100
METRIC RATING
300th/ 347
METRIC RANK
15.4%
FEMALE POVERTY AMONG 25-34 YEAR OLDS
0.1/ 100
METRIC RATING
265th/ 347
METRIC RANK
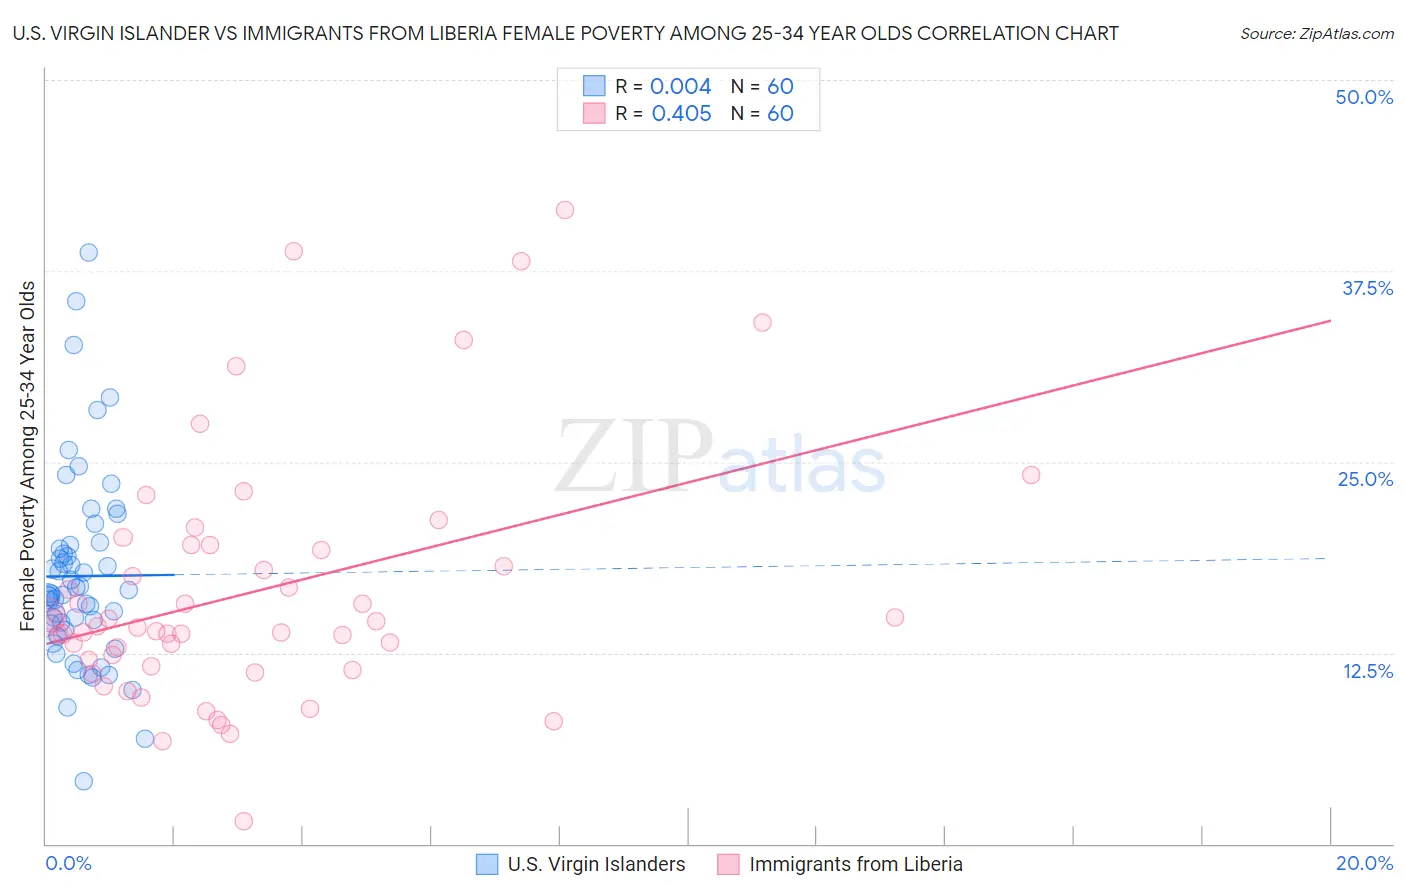
U.S. Virgin Islander vs Immigrants from Liberia Female Poverty Among 25-34 Year Olds Correlation Chart
The statistical analysis conducted on geographies consisting of 87,236,206 people shows no correlation between the proportion of U.S. Virgin Islanders and poverty level among females between the ages 25 and 34 in the United States with a correlation coefficient (R) of 0.004 and weighted average of 16.7%. Similarly, the statistical analysis conducted on geographies consisting of 134,650,303 people shows a moderate positive correlation between the proportion of Immigrants from Liberia and poverty level among females between the ages 25 and 34 in the United States with a correlation coefficient (R) of 0.405 and weighted average of 15.4%, a difference of 8.5%.
Female Poverty Among 25-34 Year Olds Correlation Summary
| Measurement | U.S. Virgin Islander | Immigrants from Liberia |
| Minimum | 4.1% | 1.5% |
| Maximum | 38.7% | 41.5% |
| Range | 34.6% | 40.0% |
| Mean | 17.5% | 16.5% |
| Median | 16.3% | 14.2% |
| Interquartile 25% (IQ1) | 14.2% | 11.8% |
| Interquartile 75% (IQ3) | 19.4% | 19.4% |
| Interquartile Range (IQR) | 5.2% | 7.5% |
| Standard Deviation (Sample) | 6.3% | 8.1% |
| Standard Deviation (Population) | 6.3% | 8.0% |
Similar Demographics by Female Poverty Among 25-34 Year Olds
Demographics Similar to U.S. Virgin Islanders by Female Poverty Among 25-34 Year Olds
In terms of female poverty among 25-34 year olds, the demographic groups most similar to U.S. Virgin Islanders are Immigrants from Congo (16.7%, a difference of 0.010%), Alaska Native (16.8%, a difference of 0.12%), Spanish American (16.7%, a difference of 0.15%), Blackfeet (16.7%, a difference of 0.19%), and Immigrants from Mexico (16.8%, a difference of 0.44%).
| Demographics | Rating | Rank | Female Poverty Among 25-34 Year Olds |
| Potawatomi | 0.0 /100 | #293 | Tragic 16.5% |
| Immigrants | Central America | 0.0 /100 | #294 | Tragic 16.6% |
| Mexicans | 0.0 /100 | #295 | Tragic 16.6% |
| Hispanics or Latinos | 0.0 /100 | #296 | Tragic 16.6% |
| Immigrants | Guatemala | 0.0 /100 | #297 | Tragic 16.6% |
| Blackfeet | 0.0 /100 | #298 | Tragic 16.7% |
| Spanish Americans | 0.0 /100 | #299 | Tragic 16.7% |
| U.S. Virgin Islanders | 0.0 /100 | #300 | Tragic 16.7% |
| Immigrants | Congo | 0.0 /100 | #301 | Tragic 16.7% |
| Alaska Natives | 0.0 /100 | #302 | Tragic 16.8% |
| Immigrants | Mexico | 0.0 /100 | #303 | Tragic 16.8% |
| Hondurans | 0.0 /100 | #304 | Tragic 16.9% |
| Immigrants | Cabo Verde | 0.0 /100 | #305 | Tragic 16.9% |
| Chickasaw | 0.0 /100 | #306 | Tragic 17.0% |
| Yaqui | 0.0 /100 | #307 | Tragic 17.0% |
Demographics Similar to Immigrants from Liberia by Female Poverty Among 25-34 Year Olds
In terms of female poverty among 25-34 year olds, the demographic groups most similar to Immigrants from Liberia are Immigrants from Somalia (15.4%, a difference of 0.010%), Pennsylvania German (15.4%, a difference of 0.030%), Central American (15.5%, a difference of 0.39%), Mexican American Indian (15.4%, a difference of 0.47%), and Immigrants from Belize (15.3%, a difference of 0.71%).
| Demographics | Rating | Rank | Female Poverty Among 25-34 Year Olds |
| Nepalese | 0.2 /100 | #258 | Tragic 15.2% |
| Immigrants | Cuba | 0.2 /100 | #259 | Tragic 15.2% |
| Marshallese | 0.2 /100 | #260 | Tragic 15.3% |
| Liberians | 0.2 /100 | #261 | Tragic 15.3% |
| Immigrants | Belize | 0.2 /100 | #262 | Tragic 15.3% |
| Mexican American Indians | 0.2 /100 | #263 | Tragic 15.4% |
| Pennsylvania Germans | 0.1 /100 | #264 | Tragic 15.4% |
| Immigrants | Liberia | 0.1 /100 | #265 | Tragic 15.4% |
| Immigrants | Somalia | 0.1 /100 | #266 | Tragic 15.4% |
| Central Americans | 0.1 /100 | #267 | Tragic 15.5% |
| Immigrants | Senegal | 0.1 /100 | #268 | Tragic 15.6% |
| Sub-Saharan Africans | 0.1 /100 | #269 | Tragic 15.6% |
| British West Indians | 0.1 /100 | #270 | Tragic 15.6% |
| Cree | 0.1 /100 | #271 | Tragic 15.6% |
| Senegalese | 0.1 /100 | #272 | Tragic 15.6% |