Afghan vs Immigrants from Honduras Single Father Poverty

COMPARE

Afghan
Race
Ancestry
AfghanAfricanAlaska NativeAlaskan AthabascanAlbanianAleutAlsatianAmericanApacheArabArapahoArgentineanArmenianAssyrian/Chaldean/SyriacAustralianAustrianBahamianBangladeshiBarbadianBasqueBelgianBelizeanBermudanBhutaneseBlackfeetBolivianBrazilianBritishBritish West IndianBulgarianBurmeseCajunCambodianCanadianCape VerdeanCarpatho RusynCelticCentral AmericanCentral American IndianCherokeeCheyenneChickasawChileanChineseChippewaChoctawColombianColvilleComancheCosta RicanCreeCreekCroatianCrowCubanCypriotCzechCzechoslovakianDanishDelawareDominicanDutchDutch West IndianEastern EuropeanEcuadorianEgyptianEnglishEstonianEthiopianEuropeanFijianFilipinoFinnishFrenchFrench American IndianFrench CanadianGermanGerman RussianGhanaianGreekGuamanian/ChamorroGuatemalanGuyaneseHaitianHmongHonduranHopiHoumaHungarianIcelanderIndian (Asian)IndonesianInupiatIranianIraqiIrishIroquoisIsraeliItalianJamaicanJapaneseJordanianKenyanKiowaKoreanLaotianLatvianLebaneseLiberianLithuanianLumbeeLuxembourgerMacedonianMalaysianMalteseMarshalleseMenomineeMexicanMexican American IndianMongolianMoroccanNative HawaiianNavajoNepaleseNew ZealanderNicaraguanNigerianNorthern EuropeanNorwegianOkinawanOsageOttawaPaiutePakistaniPalestinianPanamanianParaguayanPennsylvania GermanPeruvianPimaPolishPortuguesePotawatomiPuebloPuerto RicanPuget Sound SalishRomanianRussianSalvadoranSamoanScandinavianScotch-IrishScottishSeminoleSenegaleseSerbianShoshoneSierra LeoneanSiouxSlavicSlovakSloveneSomaliSouth AfricanSouth AmericanSouth American IndianSoviet UnionSpaniardSpanishSpanish AmericanSpanish American IndianSri LankanSubsaharan AfricanSudaneseSwedishSwissSyrianTaiwaneseThaiTlingit-HaidaTohono O'OdhamTonganTrinidadian and TobagonianTsimshianTurkishU.S. Virgin IslanderUgandanUkrainianUruguayanUteVenezuelanVietnameseWelshWest IndianYakamaYaquiYugoslavianYumanYup'ikZimbabwean
Immigration
NonimmigrantsImmigrantsAfghanistanAfricaAlbaniaArgentinaArmeniaAsiaAustraliaAustriaBahamasBangladeshBarbadosBelarusBelgiumBelizeBoliviaBosnia and HerzegovinaBrazilBulgariaBurma/MyanmarCabo VerdeCambodiaCameroonCanadaCaribbeanCentral AmericaChileChinaColombiaCongoCosta RicaCroatiaCubaCzechoslovakiaDenmarkDominicaDominican RepublicEastern AfricaEastern AsiaEastern EuropeEcuadorEgyptEl SalvadorEnglandEritreaEthiopiaEuropeFijiFranceGermanyGhanaGreeceGrenadaGuatemalaGuyanaHaitiHong KongHungaryIndiaIndonesiaIranIraqIrelandIsraelItalyJamaicaJapanJordanKazakhstanKenyaKoreaKuwaitLaosLatin AmericaLatviaLebanonLiberiaLithuaniaMalaysiaMexicoMicronesiaMiddle AfricaMoldovaMoroccoNepalNetherlandsNicaraguaNigeriaNorth AmericaNorth MacedoniaNorthern AfricaNorthern EuropeNorwayOceaniaPakistanPanamaPeruPhilippinesPolandPortugalRomaniaRussiaSaudi ArabiaScotlandSenegalSerbiaSierra LeoneSingaporeSomaliaSouth AfricaSouth AmericaSouth Central AsiaSouth Eastern AsiaSouthern EuropeSpainSri LankaSt. Vincent and the GrenadinesSudanSwedenSwitzerlandSyriaTaiwanThailandTrinidad and TobagoTurkeyUgandaUkraineUruguayUzbekistanVenezuelaVietnamWest IndiesWestern AfricaWestern AsiaWestern EuropeYemenZaireZimbabweAzores
Immigrants from Honduras
Race
Ancestry
AfricanAlaska NativeAlaskan AthabascanAlbanianAleutAlsatianAmericanApacheArabArapahoArgentineanArmenianAssyrian/Chaldean/SyriacAustralianAustrianBahamianBangladeshiBarbadianBasqueBelgianBelizeanBermudanBhutaneseBlackfeetBolivianBrazilianBritishBritish West IndianBulgarianBurmeseCajunCambodianCanadianCape VerdeanCarpatho RusynCelticCentral AmericanCentral American IndianCherokeeCheyenneChickasawChileanChineseChippewaChoctawColombianColvilleComancheCosta RicanCreeCreekCroatianCrowCubanCypriotCzechCzechoslovakianDanishDelawareDominicanDutchDutch West IndianEastern EuropeanEcuadorianEgyptianEnglishEstonianEthiopianEuropeanFijianFilipinoFinnishFrenchFrench American IndianFrench CanadianGermanGerman RussianGhanaianGreekGuamanian/ChamorroGuatemalanGuyaneseHaitianHmongHonduranHopiHoumaHungarianIcelanderIndian (Asian)IndonesianInupiatIranianIraqiIrishIroquoisIsraeliItalianJamaicanJapaneseJordanianKenyanKiowaKoreanLaotianLatvianLebaneseLiberianLithuanianLumbeeLuxembourgerMacedonianMalaysianMalteseMarshalleseMenomineeMexicanMexican American IndianMongolianMoroccanNative HawaiianNavajoNepaleseNew ZealanderNicaraguanNigerianNorthern EuropeanNorwegianOkinawanOsageOttawaPaiutePakistaniPalestinianPanamanianParaguayanPennsylvania GermanPeruvianPimaPolishPortuguesePotawatomiPuebloPuerto RicanPuget Sound SalishRomanianRussianSalvadoranSamoanScandinavianScotch-IrishScottishSeminoleSenegaleseSerbianShoshoneSierra LeoneanSiouxSlavicSlovakSloveneSomaliSouth AfricanSouth AmericanSouth American IndianSoviet UnionSpaniardSpanishSpanish AmericanSpanish American IndianSri LankanSubsaharan AfricanSudaneseSwedishSwissSyrianTaiwaneseThaiTlingit-HaidaTohono O'OdhamTonganTrinidadian and TobagonianTsimshianTurkishU.S. Virgin IslanderUgandanUkrainianUruguayanUteVenezuelanVietnameseWelshWest IndianYakamaYaquiYugoslavianYumanYup'ikZimbabwean
Immigration
NonimmigrantsImmigrantsAfghanistanAfricaAlbaniaArgentinaArmeniaAsiaAustraliaAustriaBahamasBangladeshBarbadosBelarusBelgiumBelizeBoliviaBosnia and HerzegovinaBrazilBulgariaBurma/MyanmarCabo VerdeCambodiaCameroonCanadaCaribbeanCentral AmericaChileChinaColombiaCongoCosta RicaCroatiaCubaCzechoslovakiaDenmarkDominicaDominican RepublicEastern AfricaEastern AsiaEastern EuropeEcuadorEgyptEl SalvadorEnglandEritreaEthiopiaEuropeFijiFranceGermanyGhanaGreeceGrenadaGuatemalaGuyanaHaitiHondurasHong KongHungaryIndiaIndonesiaIranIraqIrelandIsraelItalyJamaicaJapanJordanKazakhstanKenyaKoreaKuwaitLaosLatin AmericaLatviaLebanonLiberiaLithuaniaMalaysiaMexicoMicronesiaMiddle AfricaMoldovaMoroccoNepalNetherlandsNicaraguaNigeriaNorth AmericaNorth MacedoniaNorthern AfricaNorthern EuropeNorwayOceaniaPakistanPanamaPeruPhilippinesPolandPortugalRomaniaRussiaSaudi ArabiaScotlandSenegalSerbiaSierra LeoneSingaporeSomaliaSouth AfricaSouth AmericaSouth Central AsiaSouth Eastern AsiaSouthern EuropeSpainSri LankaSt. Vincent and the GrenadinesSudanSwedenSwitzerlandSyriaTaiwanThailandTrinidad and TobagoTurkeyUgandaUkraineUruguayUzbekistanVenezuelaVietnamWest IndiesWestern AfricaWestern AsiaWestern EuropeYemenZaireZimbabweAzores
Single Father Poverty
Income
Poverty
Unemployment
Labor Participation
Family Structure
Vehicle Availability
Education Level
Disability

Single Father Poverty Comparison

Afghans

Immigrants from Honduras

Exceptional
Tragic
14.0%
SINGLE FATHER POVERTY
100.0/ 100
METRIC RATING
9th/ 347
METRIC RANK
17.1%
SINGLE FATHER POVERTY
0.9/ 100
METRIC RATING
254th/ 347
METRIC RANK

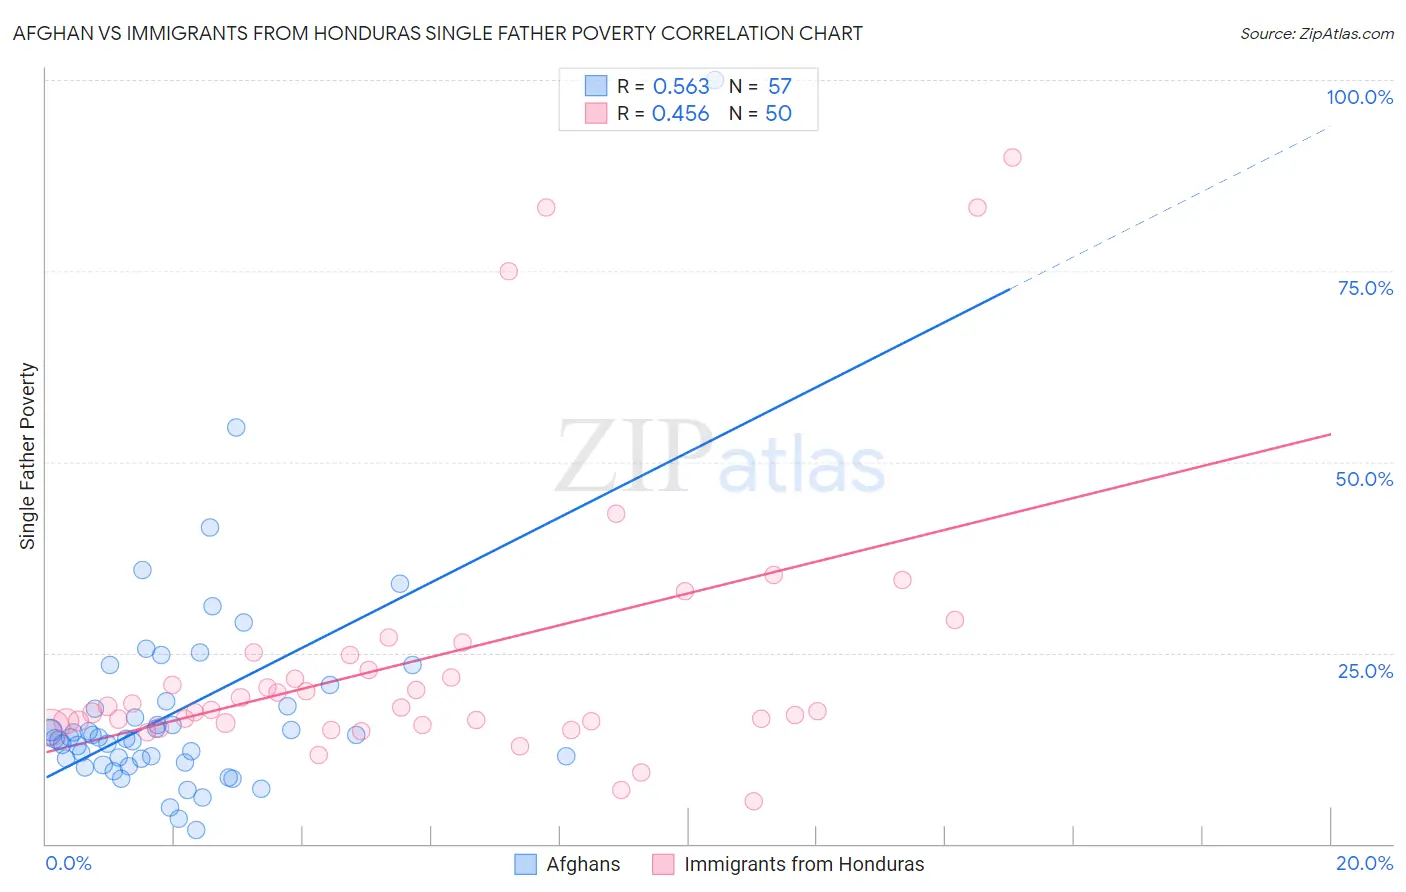
Afghan vs Immigrants from Honduras Single Father Poverty Correlation Chart

The statistical analysis conducted on geographies consisting of 131,158,904 people shows a substantial positive correlation between the proportion of Afghans and poverty level among single fathers in the United States with a correlation coefficient (R) of 0.563 and weighted average of 14.0%. Similarly, the statistical analysis conducted on geographies consisting of 269,347,803 people shows a moderate positive correlation between the proportion of Immigrants from Honduras and poverty level among single fathers in the United States with a correlation coefficient (R) of 0.456 and weighted average of 17.1%, a difference of 22.8%.
Afghan vs Immigrants from Honduras Single Father Poverty

Single Father Poverty Correlation Summary

MeasurementAfghanImmigrants from Honduras
Minimum1.7%5.5%
Maximum100.0%89.9%
Range98.3%84.4%
Mean17.5%24.3%
Median13.9%17.6%
Interquartile 25% (IQ1)10.8%15.8%
Interquartile 75% (IQ3)18.3%24.8%
Interquartile Range (IQR)7.5%9.0%
Standard Deviation (Sample)14.6%18.8%
Standard Deviation (Population)14.4%18.6%

Similar Demographics by Single Father Poverty

Demographics Similar to Afghans by Single Father Poverty

In terms of single father poverty, the demographic groups most similar to Afghans are Korean (14.0%, a difference of 0.10%), Filipino (14.0%, a difference of 0.51%), Immigrants from India (14.0%, a difference of 0.51%), Immigrants from Philippines (14.0%, a difference of 0.66%), and Samoan (13.8%, a difference of 1.1%).
DemographicsRating | RankSingle Father Poverty
Tongans
100.0
/100
|
#2
Exceptional
12.2%
Tsimshian
100.0
/100
|
#3
Exceptional
12.7%
Immigrants | Fiji
100.0
/100
|
#4
Exceptional
13.2%
Immigrants | Ethiopia
100.0
/100
|
#5
Exceptional
13.4%
Ethiopians
100.0
/100
|
#6
Exceptional
13.5%
Immigrants | Taiwan
100.0
/100
|
#7
Exceptional
13.7%
Samoans
100.0
/100
|
#8
Exceptional
13.8%
Afghans
100.0
/100
|
#9
Exceptional
14.0%
Koreans
100.0
/100
|
#10
Exceptional
14.0%
Filipinos
100.0
/100
|
#11
Exceptional
14.0%
Immigrants | India
100.0
/100
|
#12
Exceptional
14.0%
Immigrants | Philippines
100.0
/100
|
#13
Exceptional
14.0%
Immigrants | Vietnam
100.0
/100
|
#14
Exceptional
14.1%
Sri Lankans
100.0
/100
|
#15
Exceptional
14.2%
Immigrants | Iran
100.0
/100
|
#16
Exceptional
14.2%

Demographics Similar to Immigrants from Honduras by Single Father Poverty

In terms of single father poverty, the demographic groups most similar to Immigrants from Honduras are Croatian (17.1%, a difference of 0.12%), Cree (17.1%, a difference of 0.12%), Sierra Leonean (17.2%, a difference of 0.17%), Immigrants from Haiti (17.2%, a difference of 0.19%), and Luxembourger (17.1%, a difference of 0.22%).
DemographicsRating | RankSingle Father Poverty
Greeks
1.3
/100
|
#247
Tragic
17.1%
Czechoslovakians
1.3
/100
|
#248
Tragic
17.1%
Canadians
1.3
/100
|
#249
Tragic
17.1%
Austrians
1.1
/100
|
#250
Tragic
17.1%
Luxembourgers
1.1
/100
|
#251
Tragic
17.1%
Croatians
1.0
/100
|
#252
Tragic
17.1%
Cree
1.0
/100
|
#253
Tragic
17.1%
Immigrants | Honduras
0.9
/100
|
#254
Tragic
17.1%
Sierra Leoneans
0.8
/100
|
#255
Tragic
17.2%
Immigrants | Haiti
0.8
/100
|
#256
Tragic
17.2%
Immigrants | Albania
0.7
/100
|
#257
Tragic
17.2%
Albanians
0.7
/100
|
#258
Tragic
17.2%
Immigrants | Jamaica
0.7
/100
|
#259
Tragic
17.2%
Spaniards
0.6
/100
|
#260
Tragic
17.2%
Swiss
0.5
/100
|
#261
Tragic
17.3%