Ukrainian vs Portuguese Seniors Poverty Over the Age of 65
COMPARE
Ukrainian
Portuguese
Seniors Poverty Over the Age of 65
Seniors Poverty Over the Age of 65 Comparison
Ukrainians
Portuguese
10.1%
SENIORS POVERTY OVER THE AGE OF 65
96.9/ 100
METRIC RATING
90th/ 347
METRIC RANK
10.5%
SENIORS POVERTY OVER THE AGE OF 65
84.1/ 100
METRIC RATING
139th/ 347
METRIC RANK
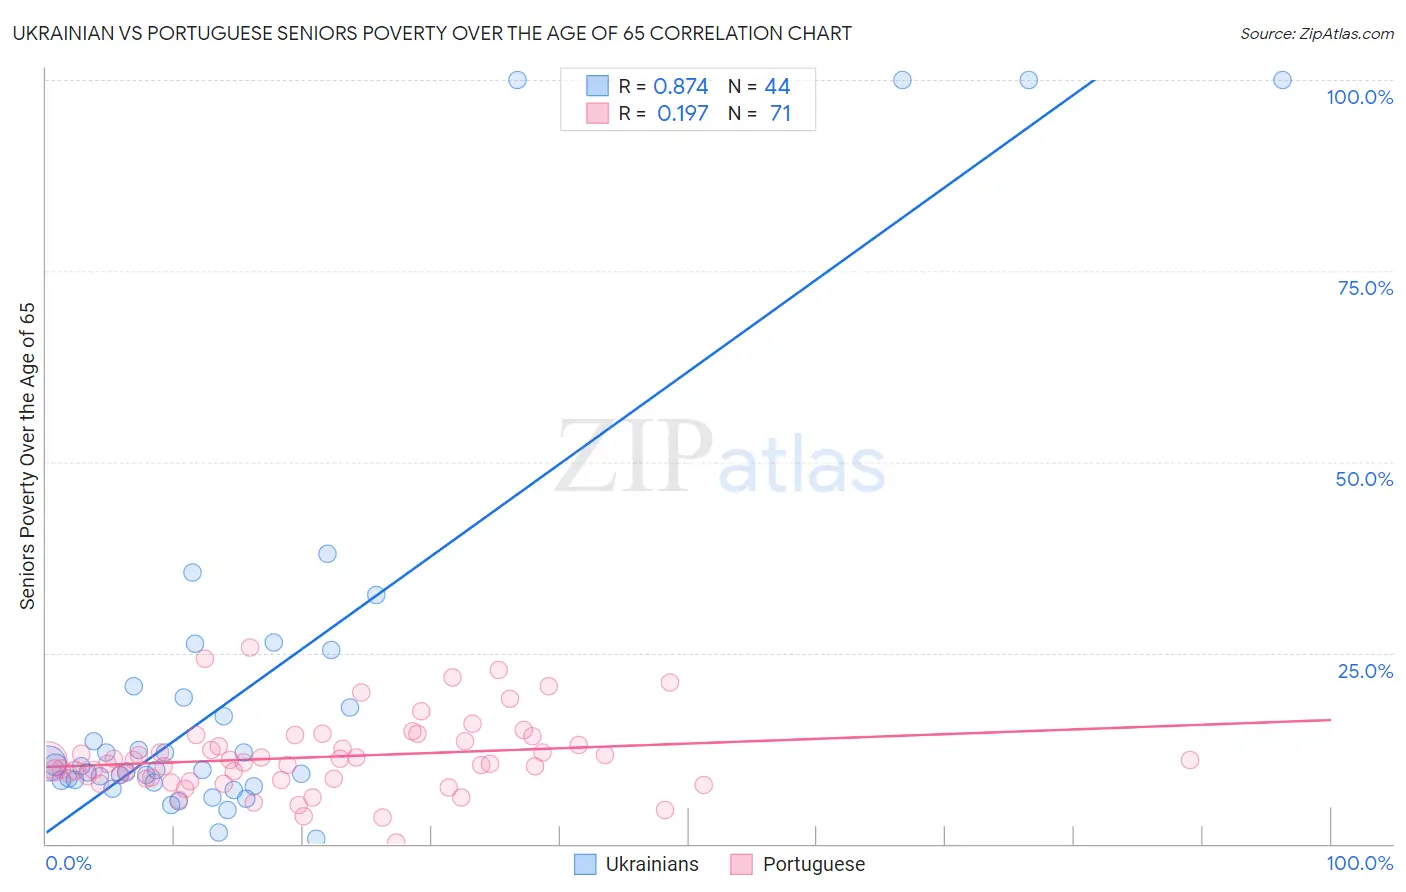
Ukrainian vs Portuguese Seniors Poverty Over the Age of 65 Correlation Chart
The statistical analysis conducted on geographies consisting of 446,354,944 people shows a very strong positive correlation between the proportion of Ukrainians and poverty level among seniors over the age of 65 in the United States with a correlation coefficient (R) of 0.874 and weighted average of 10.1%. Similarly, the statistical analysis conducted on geographies consisting of 447,984,891 people shows a poor positive correlation between the proportion of Portuguese and poverty level among seniors over the age of 65 in the United States with a correlation coefficient (R) of 0.197 and weighted average of 10.5%, a difference of 4.3%.
Seniors Poverty Over the Age of 65 Correlation Summary
| Measurement | Ukrainian | Portuguese |
| Minimum | 0.61% | 0.21% |
| Maximum | 100.0% | 25.7% |
| Range | 99.4% | 25.5% |
| Mean | 20.7% | 11.3% |
| Median | 9.9% | 10.6% |
| Interquartile 25% (IQ1) | 8.2% | 8.5% |
| Interquartile 75% (IQ3) | 19.9% | 13.4% |
| Interquartile Range (IQR) | 11.7% | 4.8% |
| Standard Deviation (Sample) | 26.7% | 4.9% |
| Standard Deviation (Population) | 26.4% | 4.9% |
Similar Demographics by Seniors Poverty Over the Age of 65
Demographics Similar to Ukrainians by Seniors Poverty Over the Age of 65
In terms of seniors poverty over the age of 65, the demographic groups most similar to Ukrainians are Puget Sound Salish (10.1%, a difference of 0.020%), Immigrants from Singapore (10.1%, a difference of 0.040%), Immigrants from Bulgaria (10.1%, a difference of 0.060%), Jordanian (10.1%, a difference of 0.14%), and Immigrants from Sweden (10.1%, a difference of 0.15%).
| Demographics | Rating | Rank | Seniors Poverty Over the Age of 65 |
| Immigrants | Poland | 97.2 /100 | #83 | Exceptional 10.1% |
| Immigrants | Afghanistan | 97.2 /100 | #84 | Exceptional 10.1% |
| Immigrants | Nepal | 97.2 /100 | #85 | Exceptional 10.1% |
| Romanians | 97.2 /100 | #86 | Exceptional 10.1% |
| Burmese | 97.2 /100 | #87 | Exceptional 10.1% |
| Jordanians | 97.1 /100 | #88 | Exceptional 10.1% |
| Immigrants | Bulgaria | 97.0 /100 | #89 | Exceptional 10.1% |
| Ukrainians | 96.9 /100 | #90 | Exceptional 10.1% |
| Puget Sound Salish | 96.9 /100 | #91 | Exceptional 10.1% |
| Immigrants | Singapore | 96.9 /100 | #92 | Exceptional 10.1% |
| Immigrants | Sweden | 96.7 /100 | #93 | Exceptional 10.1% |
| Immigrants | Germany | 96.7 /100 | #94 | Exceptional 10.1% |
| Immigrants | Japan | 96.3 /100 | #95 | Exceptional 10.1% |
| Basques | 95.9 /100 | #96 | Exceptional 10.2% |
| Immigrants | Pakistan | 95.7 /100 | #97 | Exceptional 10.2% |
Demographics Similar to Portuguese by Seniors Poverty Over the Age of 65
In terms of seniors poverty over the age of 65, the demographic groups most similar to Portuguese are Immigrants from Latvia (10.5%, a difference of 0.10%), Immigrants from Kenya (10.5%, a difference of 0.13%), Immigrants from Europe (10.5%, a difference of 0.15%), Immigrants from Australia (10.5%, a difference of 0.16%), and Osage (10.6%, a difference of 0.22%).
| Demographics | Rating | Rank | Seniors Poverty Over the Age of 65 |
| Immigrants | Turkey | 87.7 /100 | #132 | Excellent 10.5% |
| Guamanians/Chamorros | 87.5 /100 | #133 | Excellent 10.5% |
| Sierra Leoneans | 86.8 /100 | #134 | Excellent 10.5% |
| Immigrants | Norway | 86.5 /100 | #135 | Excellent 10.5% |
| Immigrants | Serbia | 86.4 /100 | #136 | Excellent 10.5% |
| Immigrants | Australia | 85.1 /100 | #137 | Excellent 10.5% |
| Immigrants | Latvia | 84.7 /100 | #138 | Excellent 10.5% |
| Portuguese | 84.1 /100 | #139 | Excellent 10.5% |
| Immigrants | Kenya | 83.4 /100 | #140 | Excellent 10.5% |
| Immigrants | Europe | 83.3 /100 | #141 | Excellent 10.5% |
| Osage | 82.8 /100 | #142 | Excellent 10.6% |
| Immigrants | Asia | 80.8 /100 | #143 | Excellent 10.6% |
| Iraqis | 80.7 /100 | #144 | Excellent 10.6% |
| Laotians | 79.9 /100 | #145 | Good 10.6% |
| Alaskan Athabascans | 79.1 /100 | #146 | Good 10.6% |