Tsimshian vs Immigrants from Romania Child Poverty Under the Age of 16
COMPARE
Tsimshian
Immigrants from Romania
Child Poverty Under the Age of 16
Child Poverty Under the Age of 16 Comparison
Tsimshian
Immigrants from Romania
14.1%
CHILD POVERTY UNDER THE AGE OF 16
98.8/ 100
METRIC RATING
54th/ 347
METRIC RANK
14.2%
CHILD POVERTY UNDER THE AGE OF 16
98.3/ 100
METRIC RATING
64th/ 347
METRIC RANK
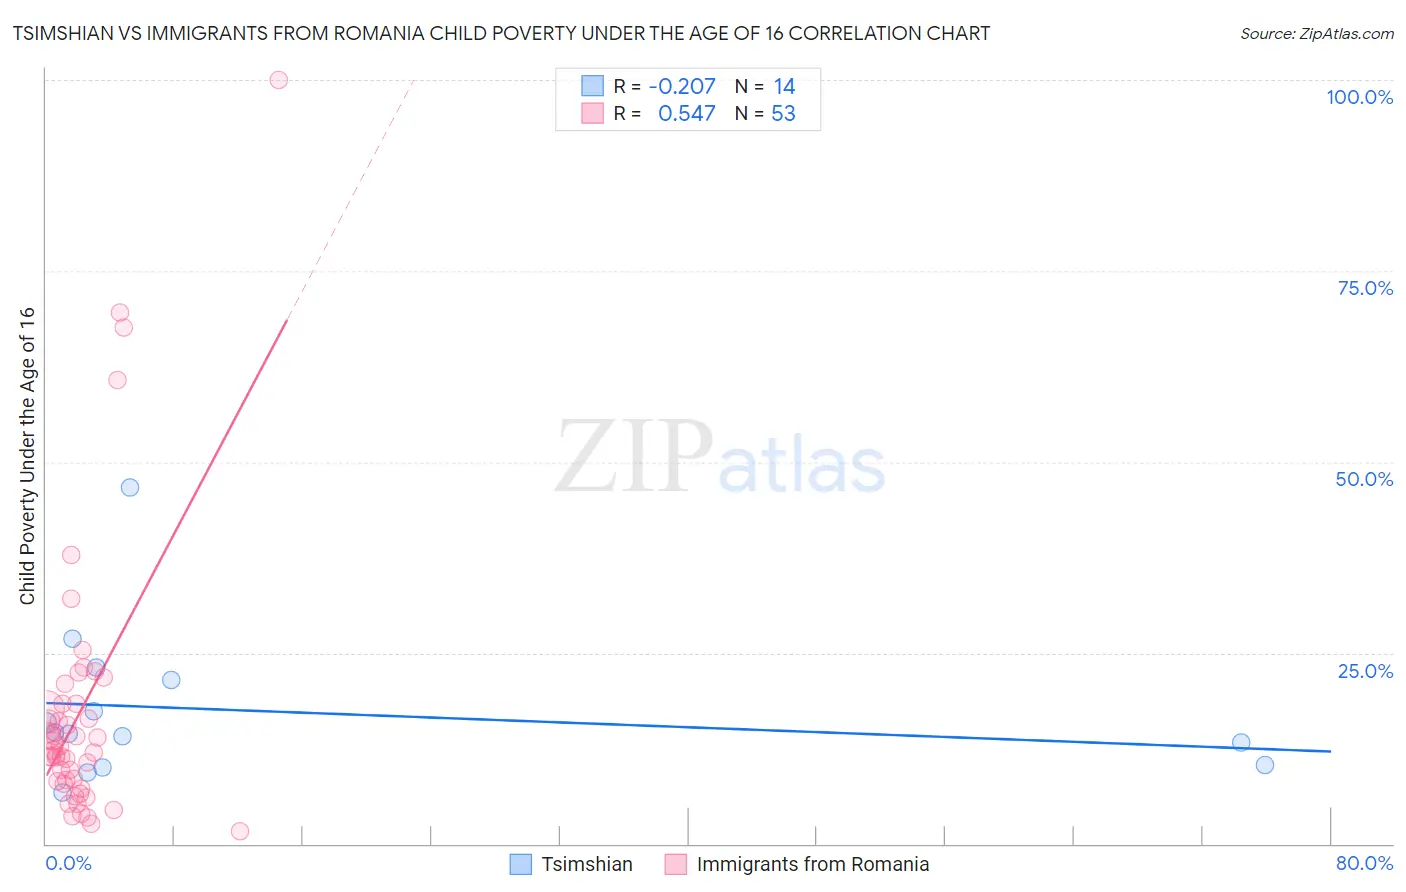
Tsimshian vs Immigrants from Romania Child Poverty Under the Age of 16 Correlation Chart
The statistical analysis conducted on geographies consisting of 15,622,353 people shows a weak negative correlation between the proportion of Tsimshian and poverty level among children under the age of 16 in the United States with a correlation coefficient (R) of -0.207 and weighted average of 14.1%. Similarly, the statistical analysis conducted on geographies consisting of 255,520,974 people shows a substantial positive correlation between the proportion of Immigrants from Romania and poverty level among children under the age of 16 in the United States with a correlation coefficient (R) of 0.547 and weighted average of 14.2%, a difference of 1.0%.
Child Poverty Under the Age of 16 Correlation Summary
| Measurement | Tsimshian | Immigrants from Romania |
| Minimum | 6.7% | 1.6% |
| Maximum | 46.7% | 100.0% |
| Range | 40.0% | 98.4% |
| Mean | 17.4% | 17.6% |
| Median | 14.5% | 12.2% |
| Interquartile 25% (IQ1) | 10.2% | 8.0% |
| Interquartile 75% (IQ3) | 21.4% | 18.3% |
| Interquartile Range (IQR) | 11.2% | 10.3% |
| Standard Deviation (Sample) | 10.1% | 18.4% |
| Standard Deviation (Population) | 9.7% | 18.2% |
Demographics Similar to Tsimshian and Immigrants from Romania by Child Poverty Under the Age of 16
In terms of child poverty under the age of 16, the demographic groups most similar to Tsimshian are Immigrants from Israel (14.1%, a difference of 0.020%), Immigrants from Indonesia (14.1%, a difference of 0.070%), Immigrants from Serbia (14.1%, a difference of 0.24%), Immigrants from Belgium (14.1%, a difference of 0.33%), and Polish (14.0%, a difference of 0.34%). Similarly, the demographic groups most similar to Immigrants from Romania are Immigrants from Europe (14.2%, a difference of 0.13%), Immigrants from Philippines (14.3%, a difference of 0.26%), Zimbabwean (14.2%, a difference of 0.44%), Slovene (14.3%, a difference of 0.44%), and Immigrants from Sweden (14.2%, a difference of 0.45%).
| Demographics | Rating | Rank | Child Poverty Under the Age of 16 |
| Italians | 99.2 /100 | #49 | Exceptional 13.9% |
| Immigrants | Czechoslovakia | 99.1 /100 | #50 | Exceptional 13.9% |
| Immigrants | Greece | 99.1 /100 | #51 | Exceptional 13.9% |
| Poles | 98.9 /100 | #52 | Exceptional 14.0% |
| Immigrants | Israel | 98.8 /100 | #53 | Exceptional 14.1% |
| Tsimshian | 98.8 /100 | #54 | Exceptional 14.1% |
| Immigrants | Indonesia | 98.7 /100 | #55 | Exceptional 14.1% |
| Immigrants | Serbia | 98.7 /100 | #56 | Exceptional 14.1% |
| Immigrants | Belgium | 98.6 /100 | #57 | Exceptional 14.1% |
| Immigrants | Pakistan | 98.6 /100 | #58 | Exceptional 14.1% |
| Scandinavians | 98.6 /100 | #59 | Exceptional 14.1% |
| Immigrants | Austria | 98.5 /100 | #60 | Exceptional 14.2% |
| Immigrants | Sweden | 98.5 /100 | #61 | Exceptional 14.2% |
| Zimbabweans | 98.5 /100 | #62 | Exceptional 14.2% |
| Immigrants | Europe | 98.4 /100 | #63 | Exceptional 14.2% |
| Immigrants | Romania | 98.3 /100 | #64 | Exceptional 14.2% |
| Immigrants | Philippines | 98.2 /100 | #65 | Exceptional 14.3% |
| Slovenes | 98.1 /100 | #66 | Exceptional 14.3% |
| Europeans | 98.1 /100 | #67 | Exceptional 14.3% |
| Laotians | 98.0 /100 | #68 | Exceptional 14.3% |
| Immigrants | Bulgaria | 98.0 /100 | #69 | Exceptional 14.3% |