Tsimshian vs Vietnamese Child Poverty Under the Age of 16
COMPARE
Tsimshian
Vietnamese
Child Poverty Under the Age of 16
Child Poverty Under the Age of 16 Comparison
Tsimshian
Vietnamese
14.1%
CHILD POVERTY UNDER THE AGE OF 16
98.8/ 100
METRIC RATING
54th/ 347
METRIC RANK
19.4%
CHILD POVERTY UNDER THE AGE OF 16
0.1/ 100
METRIC RATING
263rd/ 347
METRIC RANK
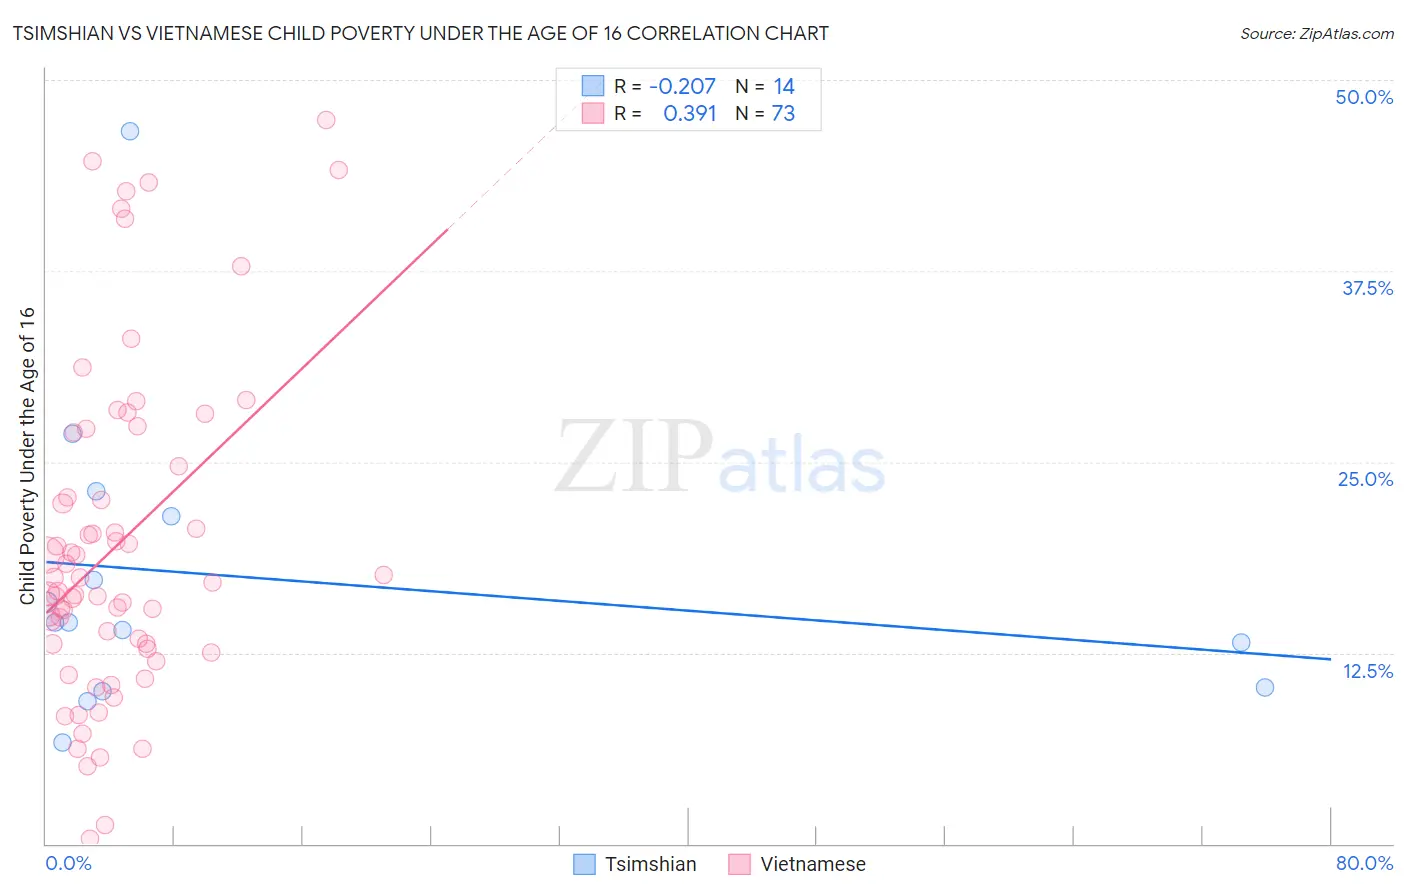
Tsimshian vs Vietnamese Child Poverty Under the Age of 16 Correlation Chart
The statistical analysis conducted on geographies consisting of 15,622,353 people shows a weak negative correlation between the proportion of Tsimshian and poverty level among children under the age of 16 in the United States with a correlation coefficient (R) of -0.207 and weighted average of 14.1%. Similarly, the statistical analysis conducted on geographies consisting of 170,322,971 people shows a mild positive correlation between the proportion of Vietnamese and poverty level among children under the age of 16 in the United States with a correlation coefficient (R) of 0.391 and weighted average of 19.4%, a difference of 38.0%.
Child Poverty Under the Age of 16 Correlation Summary
| Measurement | Tsimshian | Vietnamese |
| Minimum | 6.7% | 0.30% |
| Maximum | 46.7% | 47.4% |
| Range | 40.0% | 47.1% |
| Mean | 17.4% | 19.6% |
| Median | 14.5% | 17.1% |
| Interquartile 25% (IQ1) | 10.2% | 12.9% |
| Interquartile 75% (IQ3) | 21.4% | 25.8% |
| Interquartile Range (IQR) | 11.2% | 12.9% |
| Standard Deviation (Sample) | 10.1% | 10.7% |
| Standard Deviation (Population) | 9.7% | 10.7% |
Similar Demographics by Child Poverty Under the Age of 16
Demographics Similar to Tsimshian by Child Poverty Under the Age of 16
In terms of child poverty under the age of 16, the demographic groups most similar to Tsimshian are Immigrants from Israel (14.1%, a difference of 0.020%), Immigrants from Indonesia (14.1%, a difference of 0.070%), Immigrants from Serbia (14.1%, a difference of 0.24%), Immigrants from Belgium (14.1%, a difference of 0.33%), and Polish (14.0%, a difference of 0.34%).
| Demographics | Rating | Rank | Child Poverty Under the Age of 16 |
| Estonians | 99.2 /100 | #47 | Exceptional 13.9% |
| Koreans | 99.2 /100 | #48 | Exceptional 13.9% |
| Italians | 99.2 /100 | #49 | Exceptional 13.9% |
| Immigrants | Czechoslovakia | 99.1 /100 | #50 | Exceptional 13.9% |
| Immigrants | Greece | 99.1 /100 | #51 | Exceptional 13.9% |
| Poles | 98.9 /100 | #52 | Exceptional 14.0% |
| Immigrants | Israel | 98.8 /100 | #53 | Exceptional 14.1% |
| Tsimshian | 98.8 /100 | #54 | Exceptional 14.1% |
| Immigrants | Indonesia | 98.7 /100 | #55 | Exceptional 14.1% |
| Immigrants | Serbia | 98.7 /100 | #56 | Exceptional 14.1% |
| Immigrants | Belgium | 98.6 /100 | #57 | Exceptional 14.1% |
| Immigrants | Pakistan | 98.6 /100 | #58 | Exceptional 14.1% |
| Scandinavians | 98.6 /100 | #59 | Exceptional 14.1% |
| Immigrants | Austria | 98.5 /100 | #60 | Exceptional 14.2% |
| Immigrants | Sweden | 98.5 /100 | #61 | Exceptional 14.2% |
Demographics Similar to Vietnamese by Child Poverty Under the Age of 16
In terms of child poverty under the age of 16, the demographic groups most similar to Vietnamese are Immigrants from Ecuador (19.4%, a difference of 0.060%), Chickasaw (19.5%, a difference of 0.18%), Liberian (19.5%, a difference of 0.28%), Immigrants from Guyana (19.4%, a difference of 0.32%), and Immigrants from Burma/Myanmar (19.4%, a difference of 0.36%).
| Demographics | Rating | Rank | Child Poverty Under the Age of 16 |
| Inupiat | 0.2 /100 | #256 | Tragic 19.2% |
| Ottawa | 0.2 /100 | #257 | Tragic 19.2% |
| Spanish Americans | 0.2 /100 | #258 | Tragic 19.2% |
| Mexican American Indians | 0.2 /100 | #259 | Tragic 19.3% |
| Guyanese | 0.2 /100 | #260 | Tragic 19.3% |
| Immigrants | Burma/Myanmar | 0.1 /100 | #261 | Tragic 19.4% |
| Immigrants | Guyana | 0.1 /100 | #262 | Tragic 19.4% |
| Vietnamese | 0.1 /100 | #263 | Tragic 19.4% |
| Immigrants | Ecuador | 0.1 /100 | #264 | Tragic 19.4% |
| Chickasaw | 0.1 /100 | #265 | Tragic 19.5% |
| Liberians | 0.1 /100 | #266 | Tragic 19.5% |
| Cherokee | 0.1 /100 | #267 | Tragic 19.5% |
| Jamaicans | 0.1 /100 | #268 | Tragic 19.7% |
| Immigrants | El Salvador | 0.1 /100 | #269 | Tragic 19.7% |
| Spanish American Indians | 0.1 /100 | #270 | Tragic 19.7% |