Immigrants from Scotland vs Yakama Seniors Poverty Over the Age of 75
COMPARE
Immigrants from Scotland
Yakama
Seniors Poverty Over the Age of 75
Seniors Poverty Over the Age of 75 Comparison
Immigrants from Scotland
Yakama
10.5%
SENIORS POVERTY OVER THE AGE OF 75
99.9/ 100
METRIC RATING
19th/ 347
METRIC RANK
18.3%
SENIORS POVERTY OVER THE AGE OF 75
0.0/ 100
METRIC RATING
337th/ 347
METRIC RANK
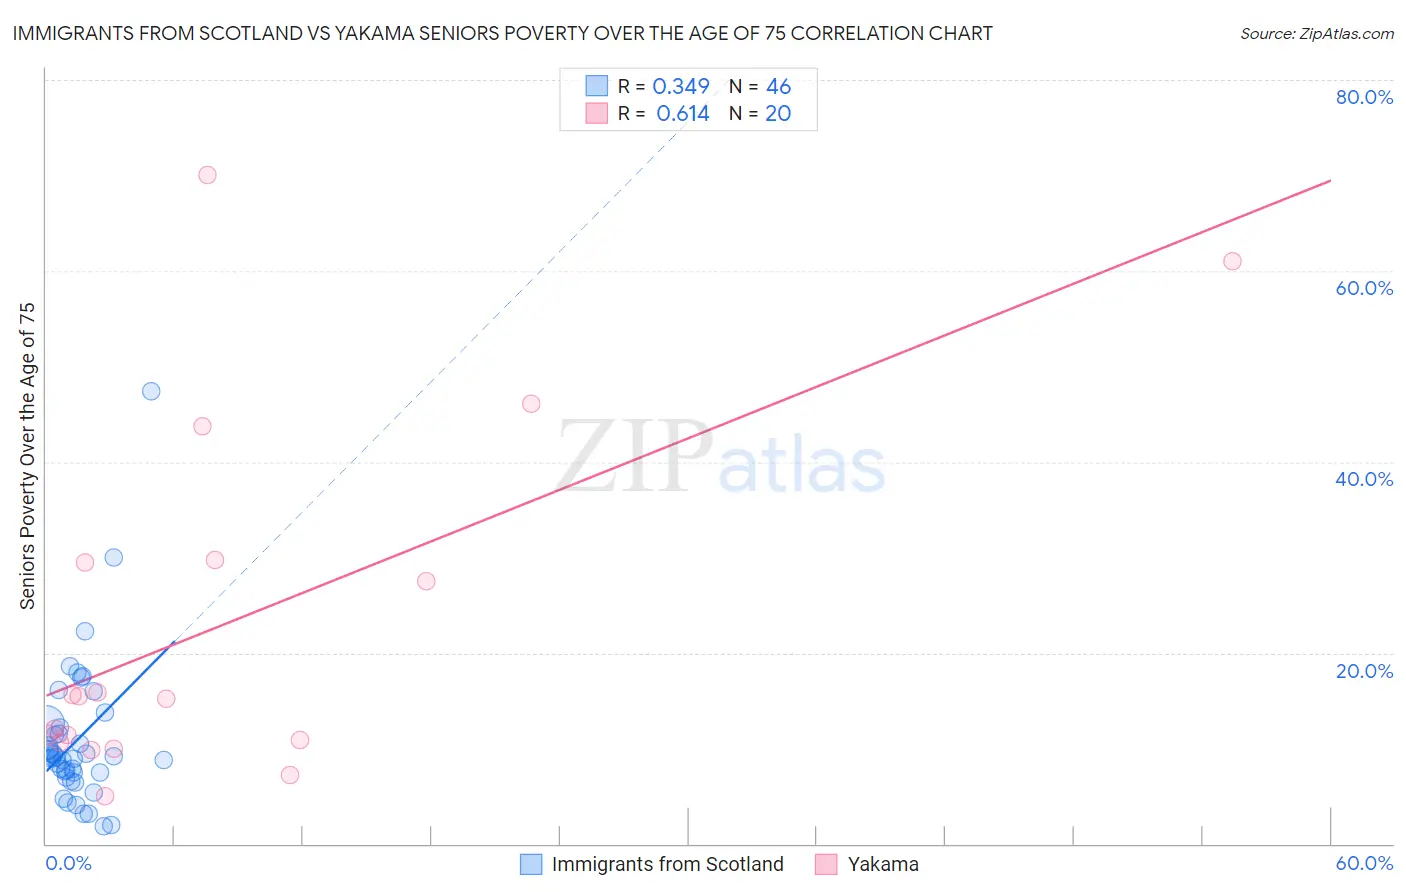
Immigrants from Scotland vs Yakama Seniors Poverty Over the Age of 75 Correlation Chart
The statistical analysis conducted on geographies consisting of 195,397,076 people shows a mild positive correlation between the proportion of Immigrants from Scotland and poverty level among seniors over the age of 75 in the United States with a correlation coefficient (R) of 0.349 and weighted average of 10.5%. Similarly, the statistical analysis conducted on geographies consisting of 19,834,385 people shows a significant positive correlation between the proportion of Yakama and poverty level among seniors over the age of 75 in the United States with a correlation coefficient (R) of 0.614 and weighted average of 18.3%, a difference of 73.7%.
Seniors Poverty Over the Age of 75 Correlation Summary
| Measurement | Immigrants from Scotland | Yakama |
| Minimum | 1.8% | 5.0% |
| Maximum | 47.4% | 70.0% |
| Range | 45.5% | 65.0% |
| Mean | 10.8% | 22.9% |
| Median | 9.0% | 15.3% |
| Interquartile 25% (IQ1) | 7.4% | 10.8% |
| Interquartile 75% (IQ3) | 12.1% | 29.6% |
| Interquartile Range (IQR) | 4.7% | 18.8% |
| Standard Deviation (Sample) | 7.7% | 18.6% |
| Standard Deviation (Population) | 7.6% | 18.1% |
Similar Demographics by Seniors Poverty Over the Age of 75
Demographics Similar to Immigrants from Scotland by Seniors Poverty Over the Age of 75
In terms of seniors poverty over the age of 75, the demographic groups most similar to Immigrants from Scotland are Czech (10.5%, a difference of 0.020%), Slovak (10.5%, a difference of 0.040%), Welsh (10.5%, a difference of 0.040%), Slovene (10.6%, a difference of 0.060%), and Dutch (10.5%, a difference of 0.25%).
| Demographics | Rating | Rank | Seniors Poverty Over the Age of 75 |
| Tongans | 99.9 /100 | #12 | Exceptional 10.5% |
| Croatians | 99.9 /100 | #13 | Exceptional 10.5% |
| Scottish | 99.9 /100 | #14 | Exceptional 10.5% |
| Europeans | 99.9 /100 | #15 | Exceptional 10.5% |
| Dutch | 99.9 /100 | #16 | Exceptional 10.5% |
| Slovaks | 99.9 /100 | #17 | Exceptional 10.5% |
| Welsh | 99.9 /100 | #18 | Exceptional 10.5% |
| Immigrants | Scotland | 99.9 /100 | #19 | Exceptional 10.5% |
| Czechs | 99.9 /100 | #20 | Exceptional 10.5% |
| Slovenes | 99.9 /100 | #21 | Exceptional 10.6% |
| Bhutanese | 99.8 /100 | #22 | Exceptional 10.6% |
| Lithuanians | 99.8 /100 | #23 | Exceptional 10.6% |
| Poles | 99.8 /100 | #24 | Exceptional 10.6% |
| Menominee | 99.8 /100 | #25 | Exceptional 10.6% |
| Bulgarians | 99.8 /100 | #26 | Exceptional 10.7% |
Demographics Similar to Yakama by Seniors Poverty Over the Age of 75
In terms of seniors poverty over the age of 75, the demographic groups most similar to Yakama are Immigrants from Caribbean (18.2%, a difference of 0.40%), Immigrants from Cabo Verde (18.5%, a difference of 0.97%), Cuban (18.0%, a difference of 2.1%), Immigrants from Grenada (17.8%, a difference of 2.6%), and Hopi (18.9%, a difference of 2.9%).
| Demographics | Rating | Rank | Seniors Poverty Over the Age of 75 |
| British West Indians | 0.0 /100 | #330 | Tragic 17.4% |
| Immigrants | Armenia | 0.0 /100 | #331 | Tragic 17.5% |
| Immigrants | St. Vincent and the Grenadines | 0.0 /100 | #332 | Tragic 17.5% |
| Immigrants | Nicaragua | 0.0 /100 | #333 | Tragic 17.6% |
| Immigrants | Grenada | 0.0 /100 | #334 | Tragic 17.8% |
| Cubans | 0.0 /100 | #335 | Tragic 18.0% |
| Immigrants | Caribbean | 0.0 /100 | #336 | Tragic 18.2% |
| Yakama | 0.0 /100 | #337 | Tragic 18.3% |
| Immigrants | Cabo Verde | 0.0 /100 | #338 | Tragic 18.5% |
| Hopi | 0.0 /100 | #339 | Tragic 18.9% |
| Tohono O'odham | 0.0 /100 | #340 | Tragic 19.1% |
| Navajo | 0.0 /100 | #341 | Tragic 19.4% |
| Dominicans | 0.0 /100 | #342 | Tragic 19.6% |
| Lumbee | 0.0 /100 | #343 | Tragic 19.7% |
| Immigrants | Cuba | 0.0 /100 | #344 | Tragic 19.9% |