Ottawa vs Immigrants from Costa Rica Female Poverty Among 18-24 Year Olds
COMPARE
Ottawa
Immigrants from Costa Rica
Female Poverty Among 18-24 Year Olds
Female Poverty Among 18-24 Year Olds Comparison
Ottawa
Immigrants from Costa Rica
22.0%
FEMALE POVERTY AMONG 18-24 YEAR OLDS
0.0/ 100
METRIC RATING
285th/ 347
METRIC RANK
18.7%
FEMALE POVERTY AMONG 18-24 YEAR OLDS
99.7/ 100
METRIC RATING
70th/ 347
METRIC RANK
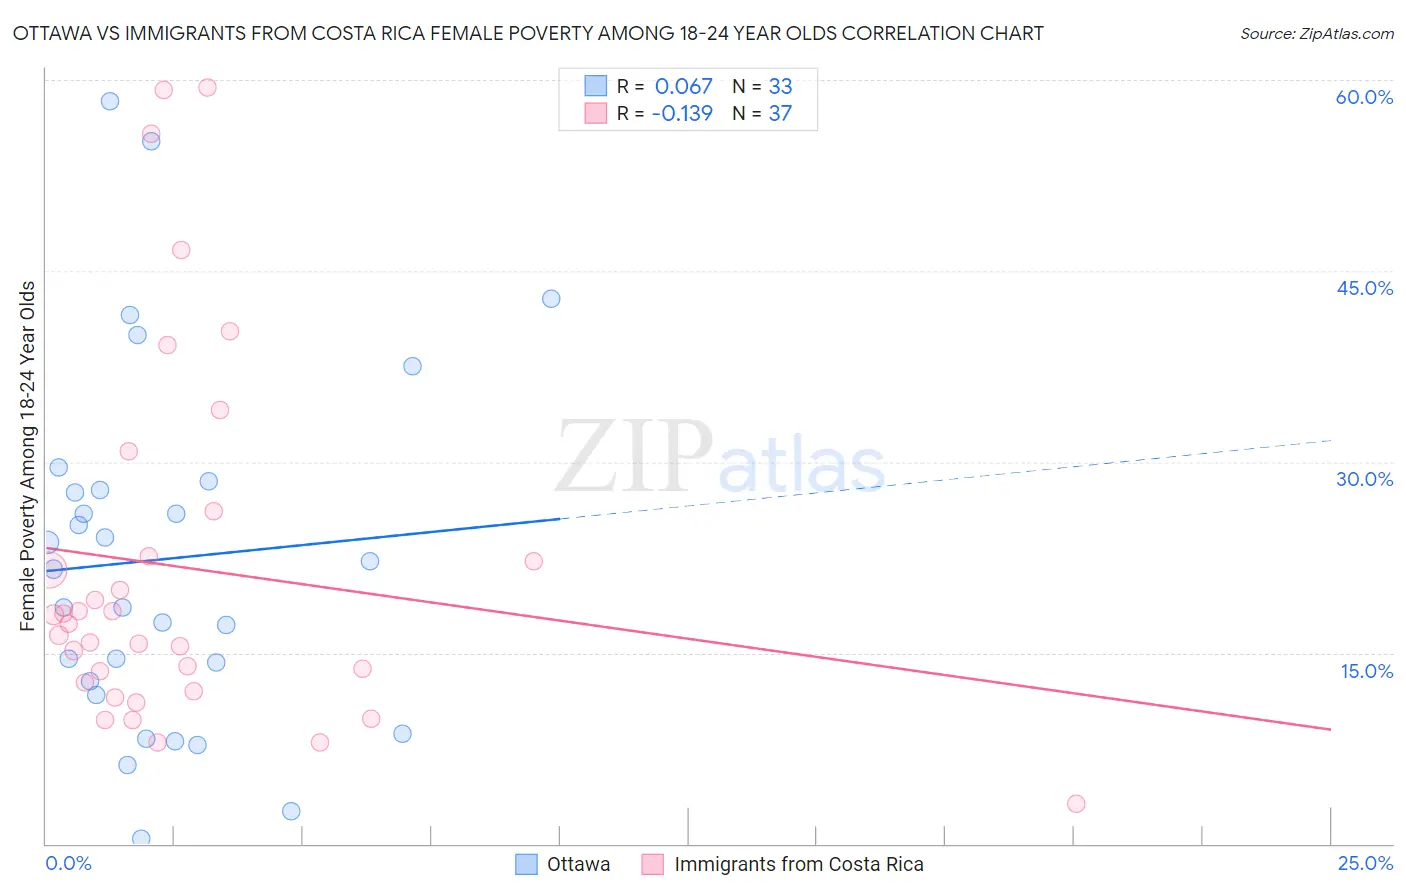
Ottawa vs Immigrants from Costa Rica Female Poverty Among 18-24 Year Olds Correlation Chart
The statistical analysis conducted on geographies consisting of 49,589,208 people shows a slight positive correlation between the proportion of Ottawa and poverty level among females between the ages 18 and 24 in the United States with a correlation coefficient (R) of 0.067 and weighted average of 22.0%. Similarly, the statistical analysis conducted on geographies consisting of 202,109,997 people shows a poor negative correlation between the proportion of Immigrants from Costa Rica and poverty level among females between the ages 18 and 24 in the United States with a correlation coefficient (R) of -0.139 and weighted average of 18.7%, a difference of 18.1%.
Female Poverty Among 18-24 Year Olds Correlation Summary
| Measurement | Ottawa | Immigrants from Costa Rica |
| Minimum | 0.42% | 3.1% |
| Maximum | 58.3% | 59.4% |
| Range | 57.9% | 56.3% |
| Mean | 22.4% | 21.7% |
| Median | 21.6% | 17.3% |
| Interquartile 25% (IQ1) | 12.2% | 12.3% |
| Interquartile 75% (IQ3) | 28.1% | 24.4% |
| Interquartile Range (IQR) | 15.9% | 12.1% |
| Standard Deviation (Sample) | 14.0% | 14.4% |
| Standard Deviation (Population) | 13.8% | 14.2% |
Similar Demographics by Female Poverty Among 18-24 Year Olds
Demographics Similar to Ottawa by Female Poverty Among 18-24 Year Olds
In terms of female poverty among 18-24 year olds, the demographic groups most similar to Ottawa are Tlingit-Haida (22.0%, a difference of 0.12%), Subsaharan African (22.0%, a difference of 0.13%), Ugandan (22.1%, a difference of 0.19%), Immigrants from Middle Africa (22.1%, a difference of 0.20%), and Bermudan (21.9%, a difference of 0.43%).
| Demographics | Rating | Rank | Female Poverty Among 18-24 Year Olds |
| Yaqui | 0.1 /100 | #278 | Tragic 21.9% |
| Spanish Americans | 0.1 /100 | #279 | Tragic 21.9% |
| Immigrants | Dominica | 0.1 /100 | #280 | Tragic 21.9% |
| Immigrants | Dominican Republic | 0.1 /100 | #281 | Tragic 21.9% |
| Bermudans | 0.1 /100 | #282 | Tragic 21.9% |
| Sub-Saharan Africans | 0.0 /100 | #283 | Tragic 22.0% |
| Tlingit-Haida | 0.0 /100 | #284 | Tragic 22.0% |
| Ottawa | 0.0 /100 | #285 | Tragic 22.0% |
| Ugandans | 0.0 /100 | #286 | Tragic 22.1% |
| Immigrants | Middle Africa | 0.0 /100 | #287 | Tragic 22.1% |
| Dominicans | 0.0 /100 | #288 | Tragic 22.3% |
| French American Indians | 0.0 /100 | #289 | Tragic 22.3% |
| Immigrants | Senegal | 0.0 /100 | #290 | Tragic 22.4% |
| Bangladeshis | 0.0 /100 | #291 | Tragic 22.5% |
| Alaskan Athabascans | 0.0 /100 | #292 | Tragic 22.5% |
Demographics Similar to Immigrants from Costa Rica by Female Poverty Among 18-24 Year Olds
In terms of female poverty among 18-24 year olds, the demographic groups most similar to Immigrants from Costa Rica are Immigrants from Haiti (18.7%, a difference of 0.060%), Armenian (18.7%, a difference of 0.090%), Immigrants from Bulgaria (18.6%, a difference of 0.11%), Lithuanian (18.7%, a difference of 0.12%), and Brazilian (18.6%, a difference of 0.22%).
| Demographics | Rating | Rank | Female Poverty Among 18-24 Year Olds |
| Immigrants | Belarus | 99.8 /100 | #63 | Exceptional 18.5% |
| Immigrants | Asia | 99.8 /100 | #64 | Exceptional 18.6% |
| Immigrants | Scotland | 99.8 /100 | #65 | Exceptional 18.6% |
| Jordanians | 99.8 /100 | #66 | Exceptional 18.6% |
| Immigrants | Korea | 99.8 /100 | #67 | Exceptional 18.6% |
| Brazilians | 99.8 /100 | #68 | Exceptional 18.6% |
| Immigrants | Bulgaria | 99.7 /100 | #69 | Exceptional 18.6% |
| Immigrants | Costa Rica | 99.7 /100 | #70 | Exceptional 18.7% |
| Immigrants | Haiti | 99.7 /100 | #71 | Exceptional 18.7% |
| Armenians | 99.7 /100 | #72 | Exceptional 18.7% |
| Lithuanians | 99.7 /100 | #73 | Exceptional 18.7% |
| Hawaiians | 99.6 /100 | #74 | Exceptional 18.7% |
| Poles | 99.6 /100 | #75 | Exceptional 18.8% |
| Immigrants | Cambodia | 99.5 /100 | #76 | Exceptional 18.8% |
| Costa Ricans | 99.5 /100 | #77 | Exceptional 18.8% |