South American Indian vs Immigrants from Australia Male Poverty
COMPARE
South American Indian
Immigrants from Australia
Male Poverty
Male Poverty Comparison
South American Indians
Immigrants from Australia
11.5%
MALE POVERTY
22.8/ 100
METRIC RATING
191st/ 347
METRIC RANK
10.2%
MALE POVERTY
97.1/ 100
METRIC RATING
69th/ 347
METRIC RANK
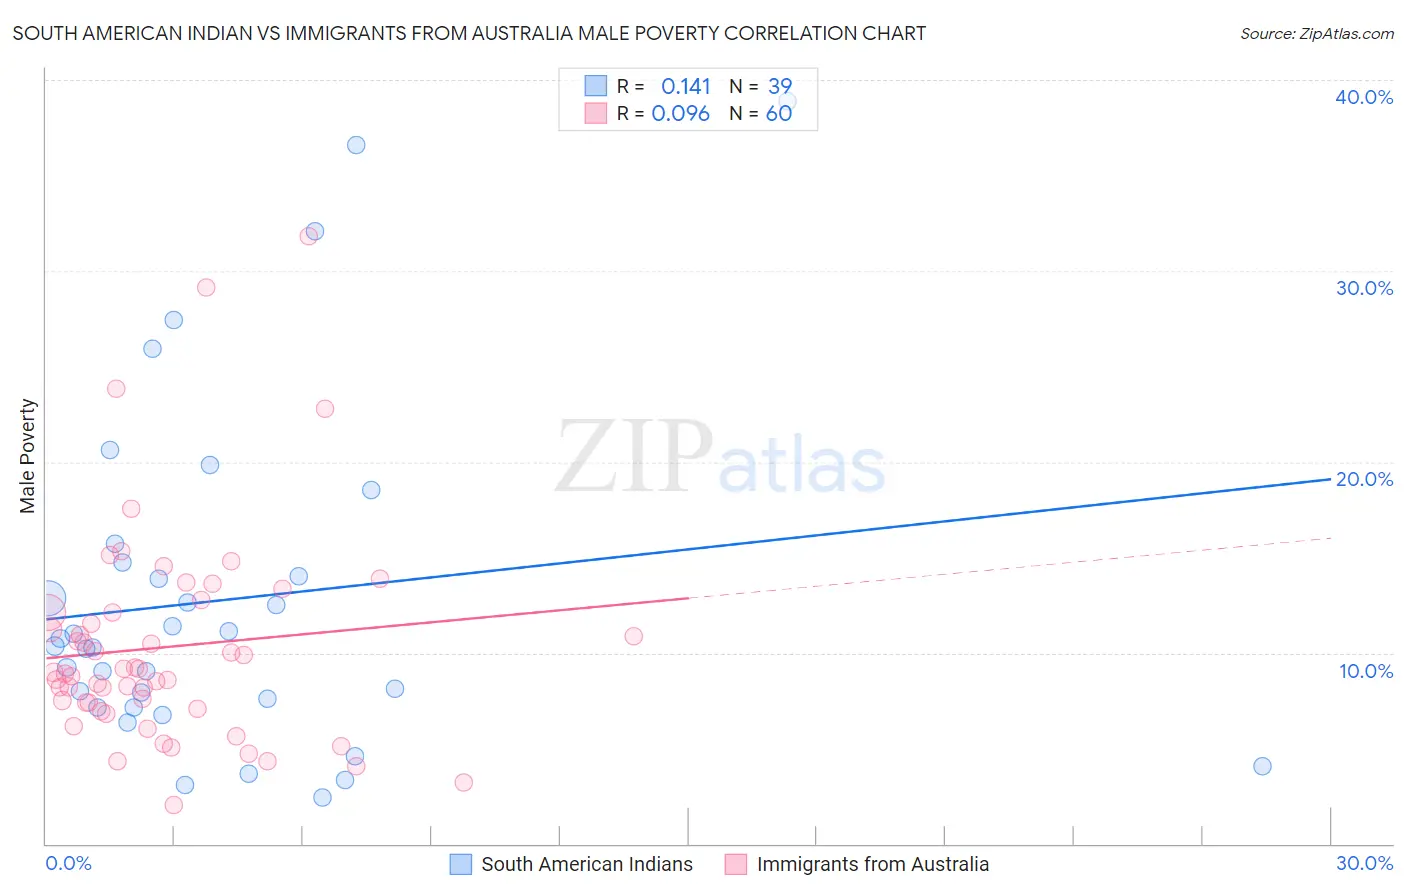
South American Indian vs Immigrants from Australia Male Poverty Correlation Chart
The statistical analysis conducted on geographies consisting of 164,512,423 people shows a poor positive correlation between the proportion of South American Indians and poverty level among males in the United States with a correlation coefficient (R) of 0.141 and weighted average of 11.5%. Similarly, the statistical analysis conducted on geographies consisting of 227,114,617 people shows a slight positive correlation between the proportion of Immigrants from Australia and poverty level among males in the United States with a correlation coefficient (R) of 0.096 and weighted average of 10.2%, a difference of 12.7%.
Male Poverty Correlation Summary
| Measurement | South American Indian | Immigrants from Australia |
| Minimum | 2.4% | 2.0% |
| Maximum | 38.9% | 31.8% |
| Range | 36.5% | 29.8% |
| Mean | 12.8% | 10.3% |
| Median | 10.3% | 8.9% |
| Interquartile 25% (IQ1) | 7.1% | 7.2% |
| Interquartile 75% (IQ3) | 14.7% | 12.1% |
| Interquartile Range (IQR) | 7.6% | 4.9% |
| Standard Deviation (Sample) | 8.9% | 5.6% |
| Standard Deviation (Population) | 8.8% | 5.6% |
Similar Demographics by Male Poverty
Demographics Similar to South American Indians by Male Poverty
In terms of male poverty, the demographic groups most similar to South American Indians are Israeli (11.5%, a difference of 0.43%), Immigrants from Uruguay (11.6%, a difference of 0.52%), Hawaiian (11.4%, a difference of 0.70%), Immigrants from Kuwait (11.6%, a difference of 0.81%), and Sierra Leonean (11.4%, a difference of 0.88%).
| Demographics | Rating | Rank | Male Poverty |
| Immigrants | South America | 36.9 /100 | #184 | Fair 11.3% |
| Immigrants | Afghanistan | 33.3 /100 | #185 | Fair 11.4% |
| Immigrants | Sierra Leone | 32.9 /100 | #186 | Fair 11.4% |
| Immigrants | Iraq | 31.9 /100 | #187 | Fair 11.4% |
| Sierra Leoneans | 29.9 /100 | #188 | Fair 11.4% |
| Hawaiians | 28.3 /100 | #189 | Fair 11.4% |
| Israelis | 26.1 /100 | #190 | Fair 11.5% |
| South American Indians | 22.8 /100 | #191 | Fair 11.5% |
| Immigrants | Uruguay | 19.1 /100 | #192 | Poor 11.6% |
| Immigrants | Kuwait | 17.3 /100 | #193 | Poor 11.6% |
| Immigrants | Kenya | 16.1 /100 | #194 | Poor 11.6% |
| Arabs | 15.8 /100 | #195 | Poor 11.6% |
| Hmong | 15.8 /100 | #196 | Poor 11.6% |
| Delaware | 15.4 /100 | #197 | Poor 11.7% |
| Iraqis | 14.7 /100 | #198 | Poor 11.7% |
Demographics Similar to Immigrants from Australia by Male Poverty
In terms of male poverty, the demographic groups most similar to Immigrants from Australia are Paraguayan (10.2%, a difference of 0.020%), European (10.2%, a difference of 0.040%), Immigrants from Canada (10.2%, a difference of 0.050%), Immigrants from Sri Lanka (10.2%, a difference of 0.13%), and Immigrants from Asia (10.2%, a difference of 0.13%).
| Demographics | Rating | Rank | Male Poverty |
| Immigrants | Italy | 97.8 /100 | #62 | Exceptional 10.2% |
| Slovaks | 97.7 /100 | #63 | Exceptional 10.2% |
| Swiss | 97.5 /100 | #64 | Exceptional 10.2% |
| Zimbabweans | 97.5 /100 | #65 | Exceptional 10.2% |
| Serbians | 97.5 /100 | #66 | Exceptional 10.2% |
| Immigrants | Netherlands | 97.3 /100 | #67 | Exceptional 10.2% |
| Immigrants | Sri Lanka | 97.2 /100 | #68 | Exceptional 10.2% |
| Immigrants | Australia | 97.1 /100 | #69 | Exceptional 10.2% |
| Paraguayans | 97.1 /100 | #70 | Exceptional 10.2% |
| Europeans | 97.1 /100 | #71 | Exceptional 10.2% |
| Immigrants | Canada | 97.1 /100 | #72 | Exceptional 10.2% |
| Immigrants | Asia | 97.0 /100 | #73 | Exceptional 10.2% |
| Immigrants | Eastern Europe | 96.9 /100 | #74 | Exceptional 10.2% |
| Carpatho Rusyns | 96.9 /100 | #75 | Exceptional 10.2% |
| Dutch | 96.9 /100 | #76 | Exceptional 10.2% |