Tlingit-Haida vs Immigrants from Scotland Associate's Degree
COMPARE
Tlingit-Haida
Immigrants from Scotland
Associate's Degree
Associate's Degree Comparison
Tlingit-Haida
Immigrants from Scotland
43.0%
ASSOCIATE'S DEGREE
2.1/ 100
METRIC RATING
234th/ 347
METRIC RANK
50.6%
ASSOCIATE'S DEGREE
99.3/ 100
METRIC RATING
75th/ 347
METRIC RANK
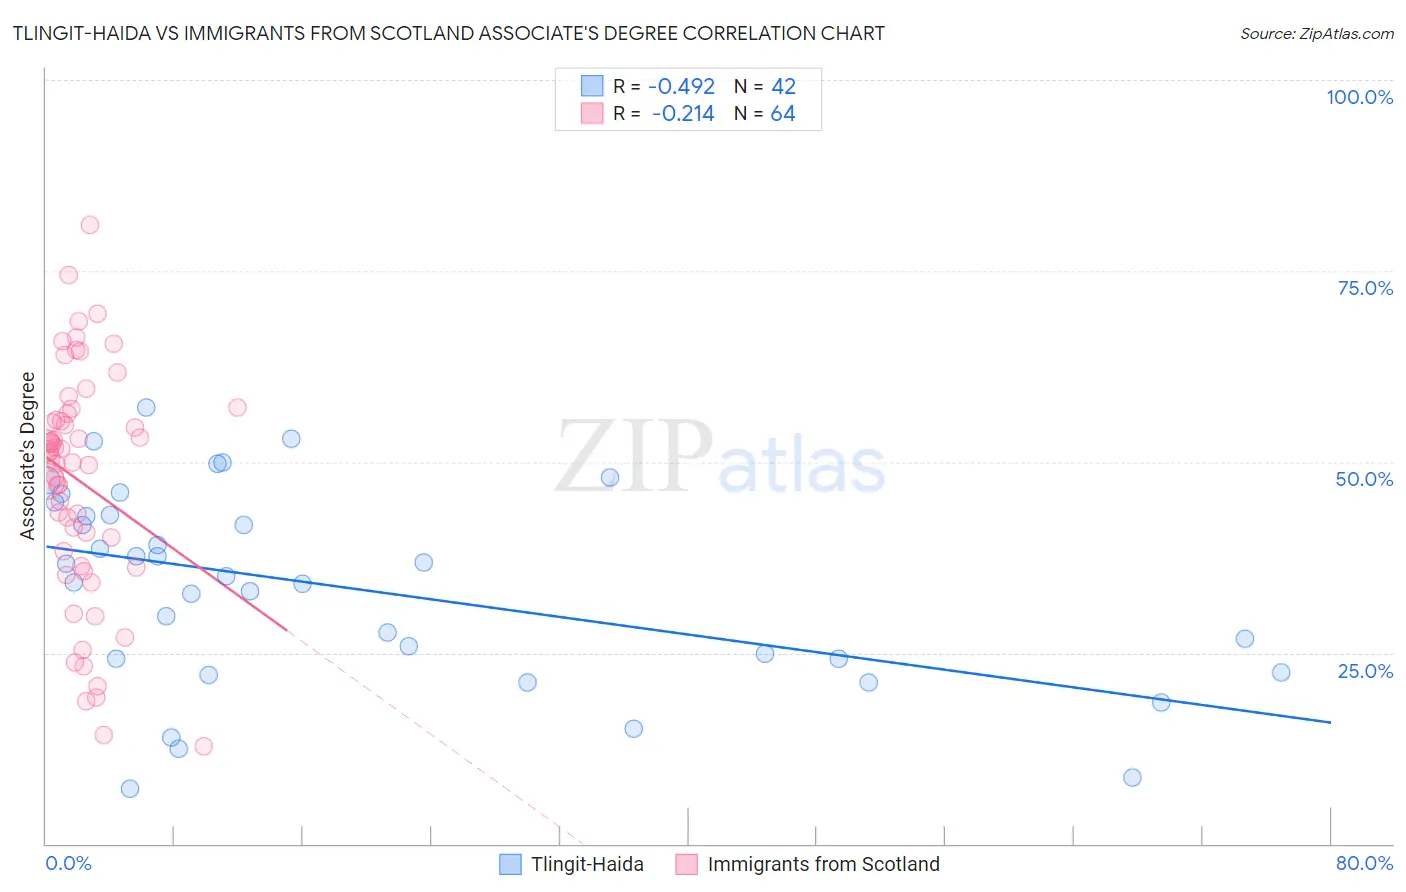
Tlingit-Haida vs Immigrants from Scotland Associate's Degree Correlation Chart
The statistical analysis conducted on geographies consisting of 60,872,339 people shows a moderate negative correlation between the proportion of Tlingit-Haida and percentage of population with at least associate's degree education in the United States with a correlation coefficient (R) of -0.492 and weighted average of 43.0%. Similarly, the statistical analysis conducted on geographies consisting of 196,397,243 people shows a weak negative correlation between the proportion of Immigrants from Scotland and percentage of population with at least associate's degree education in the United States with a correlation coefficient (R) of -0.214 and weighted average of 50.6%, a difference of 17.6%.
Associate's Degree Correlation Summary
| Measurement | Tlingit-Haida | Immigrants from Scotland |
| Minimum | 7.1% | 12.7% |
| Maximum | 57.1% | 81.0% |
| Range | 50.0% | 68.2% |
| Mean | 33.5% | 47.4% |
| Median | 34.6% | 50.9% |
| Interquartile 25% (IQ1) | 24.2% | 37.3% |
| Interquartile 75% (IQ3) | 43.0% | 55.9% |
| Interquartile Range (IQR) | 18.8% | 18.6% |
| Standard Deviation (Sample) | 12.9% | 15.1% |
| Standard Deviation (Population) | 12.7% | 14.9% |
Similar Demographics by Associate's Degree
Demographics Similar to Tlingit-Haida by Associate's Degree
In terms of associate's degree, the demographic groups most similar to Tlingit-Haida are Tongan (43.0%, a difference of 0.090%), Ecuadorian (43.0%, a difference of 0.090%), Immigrants from St. Vincent and the Grenadines (42.9%, a difference of 0.18%), Nonimmigrants (42.9%, a difference of 0.20%), and Native Hawaiian (43.1%, a difference of 0.25%).
| Demographics | Rating | Rank | Associate's Degree |
| Trinidadians and Tobagonians | 4.0 /100 | #227 | Tragic 43.6% |
| Hmong | 3.2 /100 | #228 | Tragic 43.4% |
| Immigrants | Trinidad and Tobago | 3.0 /100 | #229 | Tragic 43.3% |
| Immigrants | Barbados | 2.9 /100 | #230 | Tragic 43.3% |
| Liberians | 2.9 /100 | #231 | Tragic 43.3% |
| Native Hawaiians | 2.3 /100 | #232 | Tragic 43.1% |
| Tongans | 2.2 /100 | #233 | Tragic 43.0% |
| Tlingit-Haida | 2.1 /100 | #234 | Tragic 43.0% |
| Ecuadorians | 2.0 /100 | #235 | Tragic 43.0% |
| Immigrants | St. Vincent and the Grenadines | 1.9 /100 | #236 | Tragic 42.9% |
| Immigrants | Nonimmigrants | 1.9 /100 | #237 | Tragic 42.9% |
| Iroquois | 1.7 /100 | #238 | Tragic 42.8% |
| Immigrants | Grenada | 1.3 /100 | #239 | Tragic 42.6% |
| Cree | 1.2 /100 | #240 | Tragic 42.5% |
| British West Indians | 1.0 /100 | #241 | Tragic 42.4% |
Demographics Similar to Immigrants from Scotland by Associate's Degree
In terms of associate's degree, the demographic groups most similar to Immigrants from Scotland are Lithuanian (50.6%, a difference of 0.040%), Carpatho Rusyn (50.6%, a difference of 0.10%), Immigrants from Zimbabwe (50.5%, a difference of 0.21%), Immigrants from Lebanon (50.5%, a difference of 0.24%), and Immigrants from Eastern Europe (50.5%, a difference of 0.29%).
| Demographics | Rating | Rank | Associate's Degree |
| Immigrants | Indonesia | 99.5 /100 | #68 | Exceptional 51.0% |
| Egyptians | 99.5 /100 | #69 | Exceptional 50.9% |
| Immigrants | Argentina | 99.5 /100 | #70 | Exceptional 50.9% |
| Immigrants | Romania | 99.5 /100 | #71 | Exceptional 50.9% |
| Immigrants | Pakistan | 99.5 /100 | #72 | Exceptional 50.9% |
| Carpatho Rusyns | 99.3 /100 | #73 | Exceptional 50.6% |
| Lithuanians | 99.3 /100 | #74 | Exceptional 50.6% |
| Immigrants | Scotland | 99.3 /100 | #75 | Exceptional 50.6% |
| Immigrants | Zimbabwe | 99.2 /100 | #76 | Exceptional 50.5% |
| Immigrants | Lebanon | 99.1 /100 | #77 | Exceptional 50.5% |
| Immigrants | Eastern Europe | 99.1 /100 | #78 | Exceptional 50.5% |
| Ethiopians | 99.1 /100 | #79 | Exceptional 50.4% |
| Armenians | 99.1 /100 | #80 | Exceptional 50.4% |
| Maltese | 99.1 /100 | #81 | Exceptional 50.4% |
| Greeks | 98.9 /100 | #82 | Exceptional 50.3% |