Tlingit-Haida vs Immigrants from Scotland Female Unemployment
COMPARE
Tlingit-Haida
Immigrants from Scotland
Female Unemployment
Female Unemployment Comparison
Tlingit-Haida
Immigrants from Scotland
4.9%
FEMALE UNEMPLOYMENT
98.3/ 100
METRIC RATING
68th/ 347
METRIC RANK
4.9%
FEMALE UNEMPLOYMENT
98.6/ 100
METRIC RATING
60th/ 347
METRIC RANK
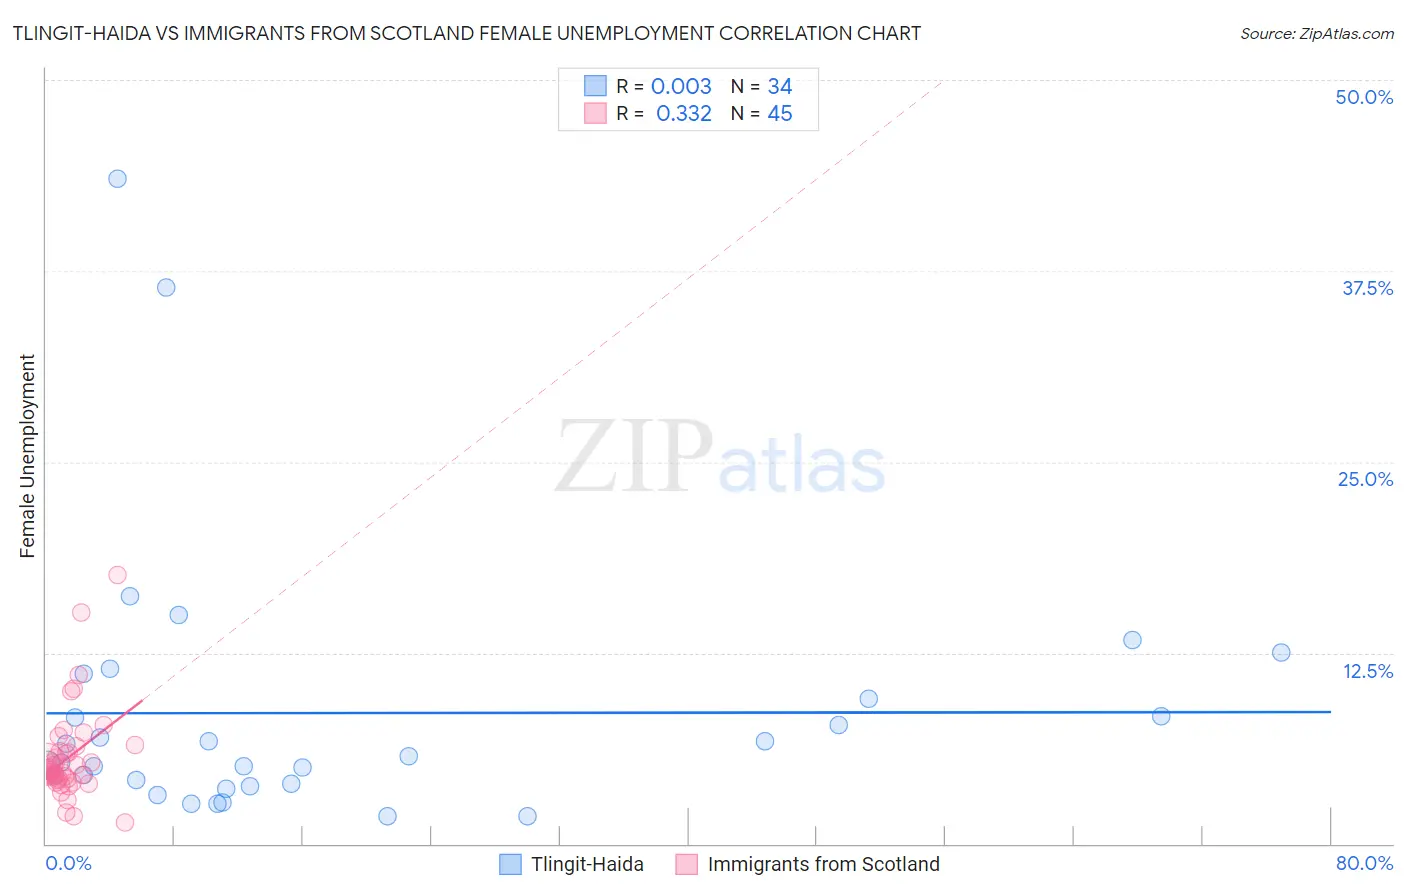
Tlingit-Haida vs Immigrants from Scotland Female Unemployment Correlation Chart
The statistical analysis conducted on geographies consisting of 60,741,997 people shows no correlation between the proportion of Tlingit-Haida and unemploymnet rate among females in the United States with a correlation coefficient (R) of 0.003 and weighted average of 4.9%. Similarly, the statistical analysis conducted on geographies consisting of 195,919,329 people shows a mild positive correlation between the proportion of Immigrants from Scotland and unemploymnet rate among females in the United States with a correlation coefficient (R) of 0.332 and weighted average of 4.9%, a difference of 0.36%.
Female Unemployment Correlation Summary
| Measurement | Tlingit-Haida | Immigrants from Scotland |
| Minimum | 1.8% | 1.4% |
| Maximum | 43.5% | 17.6% |
| Range | 41.7% | 16.2% |
| Mean | 8.6% | 5.7% |
| Median | 5.5% | 4.8% |
| Interquartile 25% (IQ1) | 3.9% | 4.2% |
| Interquartile 75% (IQ3) | 9.5% | 6.2% |
| Interquartile Range (IQR) | 5.6% | 2.0% |
| Standard Deviation (Sample) | 8.8% | 3.0% |
| Standard Deviation (Population) | 8.7% | 3.0% |
Demographics Similar to Tlingit-Haida and Immigrants from Scotland by Female Unemployment
In terms of female unemployment, the demographic groups most similar to Tlingit-Haida are Hungarian (4.9%, a difference of 0.010%), Cuban (4.9%, a difference of 0.010%), Immigrants from Ireland (4.9%, a difference of 0.010%), Immigrants from North America (4.9%, a difference of 0.040%), and Osage (4.9%, a difference of 0.050%). Similarly, the demographic groups most similar to Immigrants from Scotland are Immigrants from Canada (4.9%, a difference of 0.010%), Immigrants from Nepal (4.9%, a difference of 0.010%), Bhutanese (4.9%, a difference of 0.080%), Immigrants from Belgium (4.9%, a difference of 0.12%), and Celtic (4.9%, a difference of 0.13%).
| Demographics | Rating | Rank | Female Unemployment |
| Immigrants | Zimbabwe | 99.0 /100 | #54 | Exceptional 4.9% |
| Immigrants | Moldova | 99.0 /100 | #55 | Exceptional 4.9% |
| Serbians | 99.0 /100 | #56 | Exceptional 4.9% |
| Icelanders | 98.8 /100 | #57 | Exceptional 4.9% |
| Immigrants | Lithuania | 98.8 /100 | #58 | Exceptional 4.9% |
| Bhutanese | 98.7 /100 | #59 | Exceptional 4.9% |
| Immigrants | Scotland | 98.6 /100 | #60 | Exceptional 4.9% |
| Immigrants | Canada | 98.6 /100 | #61 | Exceptional 4.9% |
| Immigrants | Nepal | 98.6 /100 | #62 | Exceptional 4.9% |
| Immigrants | Belgium | 98.5 /100 | #63 | Exceptional 4.9% |
| Celtics | 98.5 /100 | #64 | Exceptional 4.9% |
| Immigrants | North America | 98.3 /100 | #65 | Exceptional 4.9% |
| Hungarians | 98.3 /100 | #66 | Exceptional 4.9% |
| Cubans | 98.3 /100 | #67 | Exceptional 4.9% |
| Tlingit-Haida | 98.3 /100 | #68 | Exceptional 4.9% |
| Immigrants | Ireland | 98.2 /100 | #69 | Exceptional 4.9% |
| Osage | 98.2 /100 | #70 | Exceptional 4.9% |
| German Russians | 98.1 /100 | #71 | Exceptional 4.9% |
| Immigrants | Northern Europe | 98.0 /100 | #72 | Exceptional 4.9% |
| Russians | 98.0 /100 | #73 | Exceptional 5.0% |
| Immigrants | Bolivia | 98.0 /100 | #74 | Exceptional 5.0% |