Tlingit-Haida vs Haitian Seniors Poverty Over the Age of 65
COMPARE
Tlingit-Haida
Haitian
Seniors Poverty Over the Age of 65
Seniors Poverty Over the Age of 65 Comparison
Tlingit-Haida
Haitians
8.3%
SENIORS POVERTY OVER THE AGE OF 65
100.0/ 100
METRIC RATING
2nd/ 347
METRIC RANK
14.5%
SENIORS POVERTY OVER THE AGE OF 65
0.0/ 100
METRIC RATING
317th/ 347
METRIC RANK
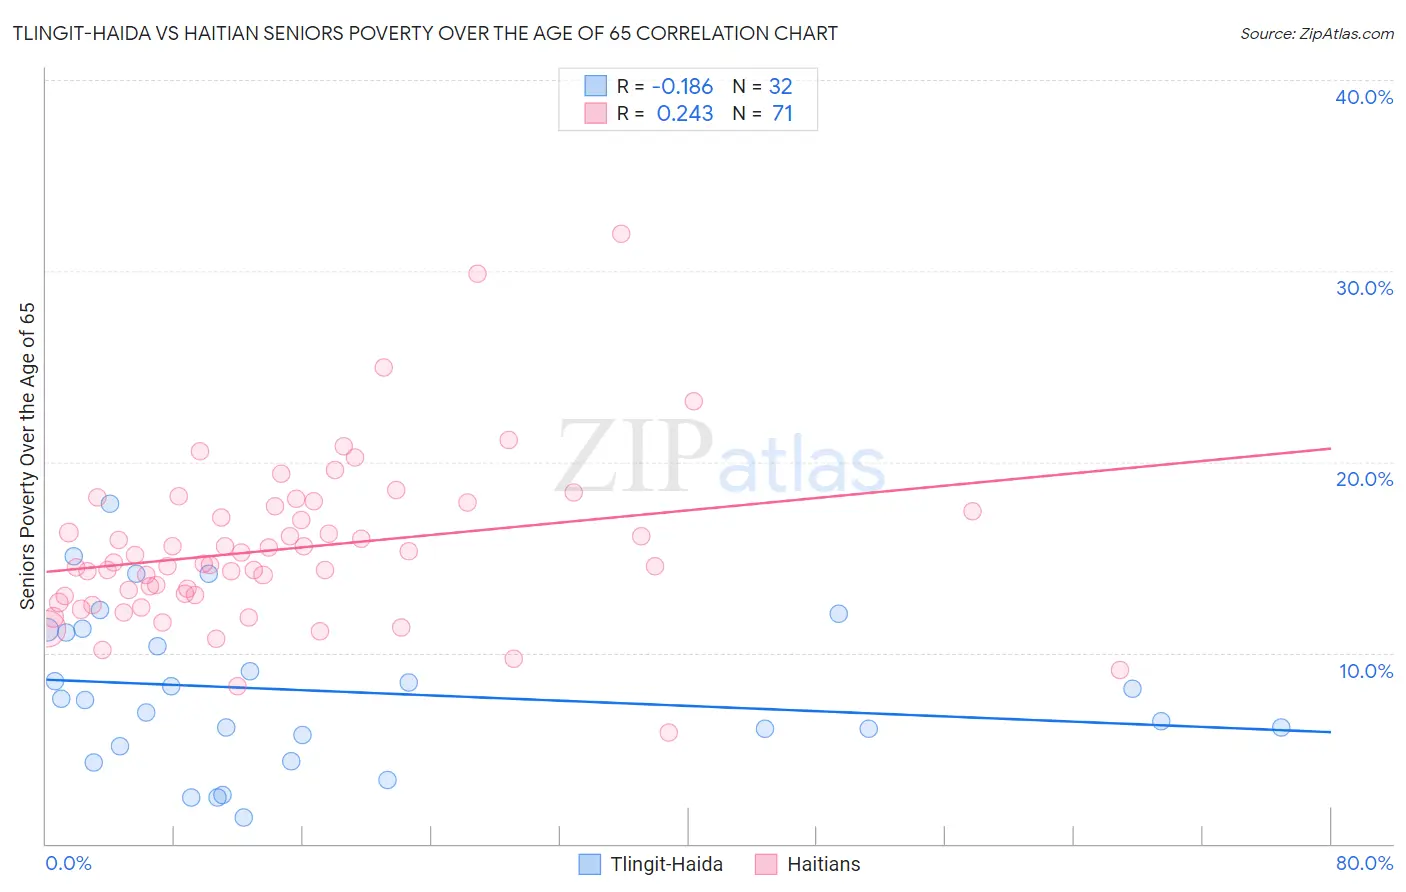
Tlingit-Haida vs Haitian Seniors Poverty Over the Age of 65 Correlation Chart
The statistical analysis conducted on geographies consisting of 60,762,722 people shows a poor negative correlation between the proportion of Tlingit-Haida and poverty level among seniors over the age of 65 in the United States with a correlation coefficient (R) of -0.186 and weighted average of 8.3%. Similarly, the statistical analysis conducted on geographies consisting of 286,889,144 people shows a weak positive correlation between the proportion of Haitians and poverty level among seniors over the age of 65 in the United States with a correlation coefficient (R) of 0.243 and weighted average of 14.5%, a difference of 73.3%.
Seniors Poverty Over the Age of 65 Correlation Summary
| Measurement | Tlingit-Haida | Haitian |
| Minimum | 1.4% | 5.8% |
| Maximum | 17.8% | 32.0% |
| Range | 16.4% | 26.2% |
| Mean | 8.0% | 15.4% |
| Median | 7.5% | 14.6% |
| Interquartile 25% (IQ1) | 5.4% | 13.0% |
| Interquartile 75% (IQ3) | 11.1% | 17.7% |
| Interquartile Range (IQR) | 5.7% | 4.7% |
| Standard Deviation (Sample) | 4.1% | 4.3% |
| Standard Deviation (Population) | 4.0% | 4.3% |
Similar Demographics by Seniors Poverty Over the Age of 65
Demographics Similar to Tlingit-Haida by Seniors Poverty Over the Age of 65
In terms of seniors poverty over the age of 65, the demographic groups most similar to Tlingit-Haida are Chinese (8.3%, a difference of 0.15%), Norwegian (8.7%, a difference of 4.0%), Swedish (8.7%, a difference of 4.7%), Immigrants from India (8.8%, a difference of 5.0%), and Danish (8.8%, a difference of 5.5%).
| Demographics | Rating | Rank | Seniors Poverty Over the Age of 65 |
| Chinese | 100.0 /100 | #1 | Exceptional 8.3% |
| Tlingit-Haida | 100.0 /100 | #2 | Exceptional 8.3% |
| Norwegians | 100.0 /100 | #3 | Exceptional 8.7% |
| Swedes | 100.0 /100 | #4 | Exceptional 8.7% |
| Immigrants | India | 100.0 /100 | #5 | Exceptional 8.8% |
| Danes | 100.0 /100 | #6 | Exceptional 8.8% |
| Germans | 100.0 /100 | #7 | Exceptional 9.0% |
| Czechs | 100.0 /100 | #8 | Exceptional 9.0% |
| English | 100.0 /100 | #9 | Exceptional 9.1% |
| Lithuanians | 100.0 /100 | #10 | Exceptional 9.1% |
| Maltese | 99.9 /100 | #11 | Exceptional 9.1% |
| Scandinavians | 99.9 /100 | #12 | Exceptional 9.1% |
| Croatians | 99.9 /100 | #13 | Exceptional 9.1% |
| Poles | 99.9 /100 | #14 | Exceptional 9.1% |
| Dutch | 99.9 /100 | #15 | Exceptional 9.1% |
Demographics Similar to Haitians by Seniors Poverty Over the Age of 65
In terms of seniors poverty over the age of 65, the demographic groups most similar to Haitians are Immigrants from Guyana (14.5%, a difference of 0.030%), Immigrants from Honduras (14.5%, a difference of 0.21%), Immigrants from Ecuador (14.4%, a difference of 0.24%), Guyanese (14.4%, a difference of 0.27%), and Barbadian (14.4%, a difference of 0.67%).
| Demographics | Rating | Rank | Seniors Poverty Over the Age of 65 |
| Bahamians | 0.0 /100 | #310 | Tragic 14.2% |
| Natives/Alaskans | 0.0 /100 | #311 | Tragic 14.2% |
| Hispanics or Latinos | 0.0 /100 | #312 | Tragic 14.3% |
| Barbadians | 0.0 /100 | #313 | Tragic 14.4% |
| Guyanese | 0.0 /100 | #314 | Tragic 14.4% |
| Immigrants | Ecuador | 0.0 /100 | #315 | Tragic 14.4% |
| Immigrants | Guyana | 0.0 /100 | #316 | Tragic 14.5% |
| Haitians | 0.0 /100 | #317 | Tragic 14.5% |
| Immigrants | Honduras | 0.0 /100 | #318 | Tragic 14.5% |
| Cape Verdeans | 0.0 /100 | #319 | Tragic 14.7% |
| Immigrants | Haiti | 0.0 /100 | #320 | Tragic 14.7% |
| Houma | 0.0 /100 | #321 | Tragic 14.7% |
| Immigrants | Barbados | 0.0 /100 | #322 | Tragic 14.8% |
| Yakama | 0.0 /100 | #323 | Tragic 14.8% |
| Nicaraguans | 0.0 /100 | #324 | Tragic 15.0% |