Immigrants from Bolivia vs Haitian Seniors Poverty Over the Age of 65
COMPARE
Immigrants from Bolivia
Haitian
Seniors Poverty Over the Age of 65
Seniors Poverty Over the Age of 65 Comparison
Immigrants from Bolivia
Haitians
10.1%
SENIORS POVERTY OVER THE AGE OF 65
97.3/ 100
METRIC RATING
82nd/ 347
METRIC RANK
14.5%
SENIORS POVERTY OVER THE AGE OF 65
0.0/ 100
METRIC RATING
317th/ 347
METRIC RANK
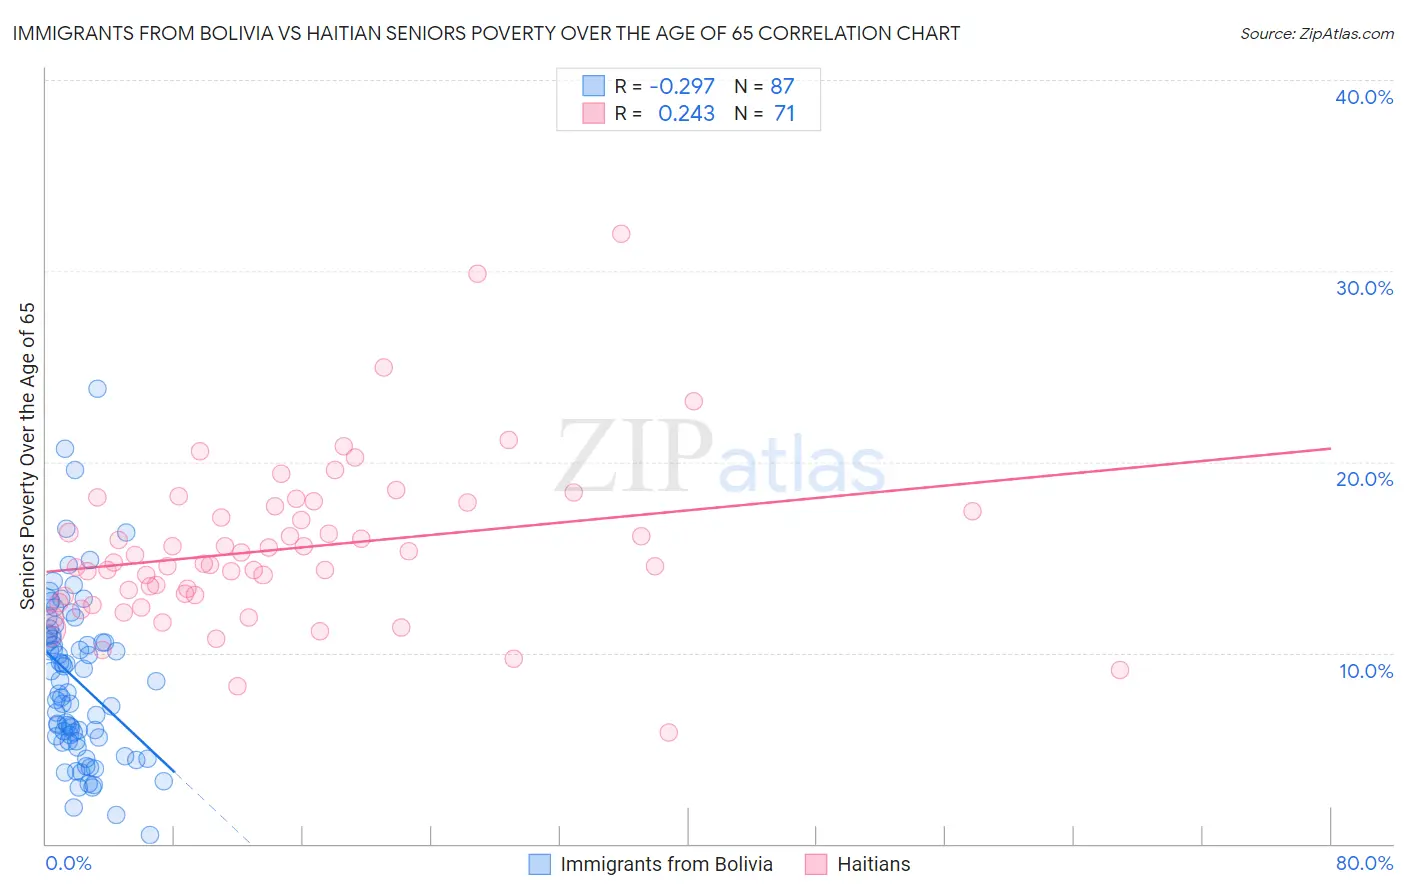
Immigrants from Bolivia vs Haitian Seniors Poverty Over the Age of 65 Correlation Chart
The statistical analysis conducted on geographies consisting of 158,579,963 people shows a weak negative correlation between the proportion of Immigrants from Bolivia and poverty level among seniors over the age of 65 in the United States with a correlation coefficient (R) of -0.297 and weighted average of 10.1%. Similarly, the statistical analysis conducted on geographies consisting of 286,889,144 people shows a weak positive correlation between the proportion of Haitians and poverty level among seniors over the age of 65 in the United States with a correlation coefficient (R) of 0.243 and weighted average of 14.5%, a difference of 43.7%.
Seniors Poverty Over the Age of 65 Correlation Summary
| Measurement | Immigrants from Bolivia | Haitian |
| Minimum | 0.47% | 5.8% |
| Maximum | 23.9% | 32.0% |
| Range | 23.4% | 26.2% |
| Mean | 8.6% | 15.4% |
| Median | 7.9% | 14.6% |
| Interquartile 25% (IQ1) | 5.4% | 13.0% |
| Interquartile 75% (IQ3) | 10.9% | 17.7% |
| Interquartile Range (IQR) | 5.5% | 4.7% |
| Standard Deviation (Sample) | 4.3% | 4.3% |
| Standard Deviation (Population) | 4.3% | 4.3% |
Similar Demographics by Seniors Poverty Over the Age of 65
Demographics Similar to Immigrants from Bolivia by Seniors Poverty Over the Age of 65
In terms of seniors poverty over the age of 65, the demographic groups most similar to Immigrants from Bolivia are Immigrants from Poland (10.1%, a difference of 0.030%), Immigrants from Afghanistan (10.1%, a difference of 0.050%), Immigrants from Nepal (10.1%, a difference of 0.060%), Immigrants from Sri Lanka (10.1%, a difference of 0.070%), and Romanian (10.1%, a difference of 0.070%).
| Demographics | Rating | Rank | Seniors Poverty Over the Age of 65 |
| Immigrants | Czechoslovakia | 97.8 /100 | #75 | Exceptional 10.0% |
| New Zealanders | 97.7 /100 | #76 | Exceptional 10.0% |
| Immigrants | South Africa | 97.7 /100 | #77 | Exceptional 10.0% |
| Whites/Caucasians | 97.5 /100 | #78 | Exceptional 10.0% |
| Immigrants | Ireland | 97.5 /100 | #79 | Exceptional 10.0% |
| Koreans | 97.4 /100 | #80 | Exceptional 10.1% |
| Immigrants | Sri Lanka | 97.3 /100 | #81 | Exceptional 10.1% |
| Immigrants | Bolivia | 97.3 /100 | #82 | Exceptional 10.1% |
| Immigrants | Poland | 97.2 /100 | #83 | Exceptional 10.1% |
| Immigrants | Afghanistan | 97.2 /100 | #84 | Exceptional 10.1% |
| Immigrants | Nepal | 97.2 /100 | #85 | Exceptional 10.1% |
| Romanians | 97.2 /100 | #86 | Exceptional 10.1% |
| Burmese | 97.2 /100 | #87 | Exceptional 10.1% |
| Jordanians | 97.1 /100 | #88 | Exceptional 10.1% |
| Immigrants | Bulgaria | 97.0 /100 | #89 | Exceptional 10.1% |
Demographics Similar to Haitians by Seniors Poverty Over the Age of 65
In terms of seniors poverty over the age of 65, the demographic groups most similar to Haitians are Immigrants from Guyana (14.5%, a difference of 0.030%), Immigrants from Honduras (14.5%, a difference of 0.21%), Immigrants from Ecuador (14.4%, a difference of 0.24%), Guyanese (14.4%, a difference of 0.27%), and Barbadian (14.4%, a difference of 0.67%).
| Demographics | Rating | Rank | Seniors Poverty Over the Age of 65 |
| Bahamians | 0.0 /100 | #310 | Tragic 14.2% |
| Natives/Alaskans | 0.0 /100 | #311 | Tragic 14.2% |
| Hispanics or Latinos | 0.0 /100 | #312 | Tragic 14.3% |
| Barbadians | 0.0 /100 | #313 | Tragic 14.4% |
| Guyanese | 0.0 /100 | #314 | Tragic 14.4% |
| Immigrants | Ecuador | 0.0 /100 | #315 | Tragic 14.4% |
| Immigrants | Guyana | 0.0 /100 | #316 | Tragic 14.5% |
| Haitians | 0.0 /100 | #317 | Tragic 14.5% |
| Immigrants | Honduras | 0.0 /100 | #318 | Tragic 14.5% |
| Cape Verdeans | 0.0 /100 | #319 | Tragic 14.7% |
| Immigrants | Haiti | 0.0 /100 | #320 | Tragic 14.7% |
| Houma | 0.0 /100 | #321 | Tragic 14.7% |
| Immigrants | Barbados | 0.0 /100 | #322 | Tragic 14.8% |
| Yakama | 0.0 /100 | #323 | Tragic 14.8% |
| Nicaraguans | 0.0 /100 | #324 | Tragic 15.0% |