Swiss vs Zimbabwean Child Poverty Under the Age of 16
COMPARE
Swiss
Zimbabwean
Child Poverty Under the Age of 16
Child Poverty Under the Age of 16 Comparison
Swiss
Zimbabweans
14.5%
CHILD POVERTY UNDER THE AGE OF 16
97.3/ 100
METRIC RATING
79th/ 347
METRIC RANK
14.2%
CHILD POVERTY UNDER THE AGE OF 16
98.5/ 100
METRIC RATING
62nd/ 347
METRIC RANK
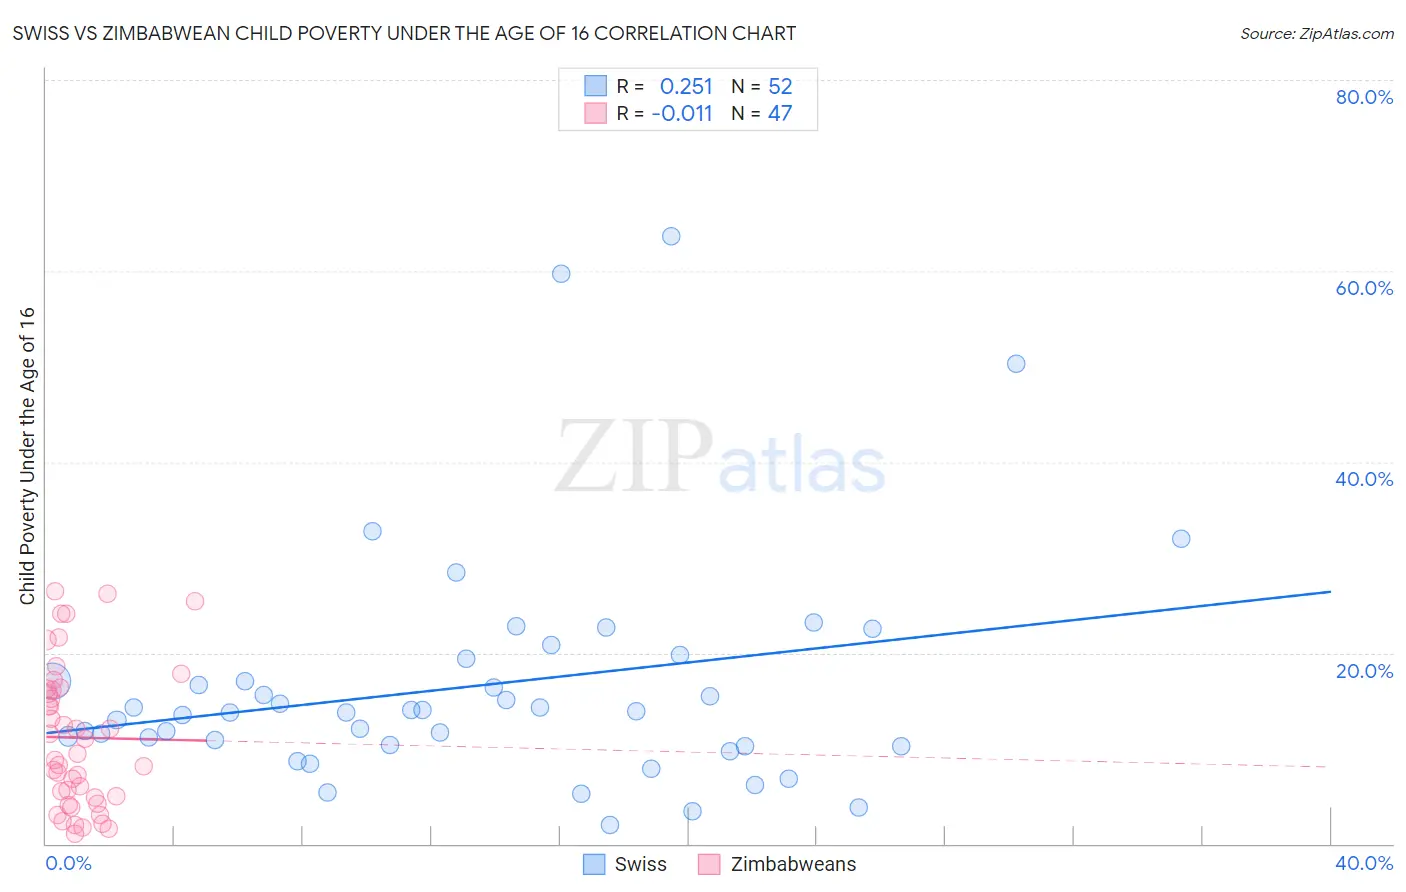
Swiss vs Zimbabwean Child Poverty Under the Age of 16 Correlation Chart
The statistical analysis conducted on geographies consisting of 458,152,839 people shows a weak positive correlation between the proportion of Swiss and poverty level among children under the age of 16 in the United States with a correlation coefficient (R) of 0.251 and weighted average of 14.5%. Similarly, the statistical analysis conducted on geographies consisting of 69,119,153 people shows no correlation between the proportion of Zimbabweans and poverty level among children under the age of 16 in the United States with a correlation coefficient (R) of -0.011 and weighted average of 14.2%, a difference of 2.1%.
Child Poverty Under the Age of 16 Correlation Summary
| Measurement | Swiss | Zimbabwean |
| Minimum | 2.0% | 1.0% |
| Maximum | 63.6% | 26.5% |
| Range | 61.7% | 25.4% |
| Mean | 16.5% | 11.1% |
| Median | 13.8% | 9.4% |
| Interquartile 25% (IQ1) | 10.3% | 4.9% |
| Interquartile 75% (IQ3) | 18.3% | 16.2% |
| Interquartile Range (IQR) | 7.9% | 11.3% |
| Standard Deviation (Sample) | 12.3% | 7.4% |
| Standard Deviation (Population) | 12.2% | 7.4% |
Demographics Similar to Swiss and Zimbabweans by Child Poverty Under the Age of 16
In terms of child poverty under the age of 16, the demographic groups most similar to Swiss are Immigrants from Russia (14.5%, a difference of 0.020%), Immigrants from North Macedonia (14.5%, a difference of 0.070%), Australian (14.4%, a difference of 0.22%), Ukrainian (14.4%, a difference of 0.25%), and Immigrants from Eastern Europe (14.4%, a difference of 0.25%). Similarly, the demographic groups most similar to Zimbabweans are Immigrants from Sweden (14.2%, a difference of 0.010%), Immigrants from Austria (14.2%, a difference of 0.050%), Immigrants from Europe (14.2%, a difference of 0.31%), Immigrants from Romania (14.2%, a difference of 0.44%), and Immigrants from Philippines (14.3%, a difference of 0.70%).
| Demographics | Rating | Rank | Child Poverty Under the Age of 16 |
| Immigrants | Austria | 98.5 /100 | #60 | Exceptional 14.2% |
| Immigrants | Sweden | 98.5 /100 | #61 | Exceptional 14.2% |
| Zimbabweans | 98.5 /100 | #62 | Exceptional 14.2% |
| Immigrants | Europe | 98.4 /100 | #63 | Exceptional 14.2% |
| Immigrants | Romania | 98.3 /100 | #64 | Exceptional 14.2% |
| Immigrants | Philippines | 98.2 /100 | #65 | Exceptional 14.3% |
| Slovenes | 98.1 /100 | #66 | Exceptional 14.3% |
| Europeans | 98.1 /100 | #67 | Exceptional 14.3% |
| Laotians | 98.0 /100 | #68 | Exceptional 14.3% |
| Immigrants | Bulgaria | 98.0 /100 | #69 | Exceptional 14.3% |
| Immigrants | Netherlands | 97.9 /100 | #70 | Exceptional 14.3% |
| Immigrants | Poland | 97.9 /100 | #71 | Exceptional 14.3% |
| Cambodians | 97.8 /100 | #72 | Exceptional 14.4% |
| Immigrants | Turkey | 97.6 /100 | #73 | Exceptional 14.4% |
| Macedonians | 97.6 /100 | #74 | Exceptional 14.4% |
| Ukrainians | 97.5 /100 | #75 | Exceptional 14.4% |
| Immigrants | Eastern Europe | 97.5 /100 | #76 | Exceptional 14.4% |
| Australians | 97.5 /100 | #77 | Exceptional 14.4% |
| Immigrants | Russia | 97.3 /100 | #78 | Exceptional 14.5% |
| Swiss | 97.3 /100 | #79 | Exceptional 14.5% |
| Immigrants | North Macedonia | 97.2 /100 | #80 | Exceptional 14.5% |