Swiss vs Immigrants from Yemen Child Poverty Under the Age of 16
COMPARE
Swiss
Immigrants from Yemen
Child Poverty Under the Age of 16
Child Poverty Under the Age of 16 Comparison
Swiss
Immigrants from Yemen
14.5%
CHILD POVERTY UNDER THE AGE OF 16
97.3/ 100
METRIC RATING
79th/ 347
METRIC RANK
29.1%
CHILD POVERTY UNDER THE AGE OF 16
0.0/ 100
METRIC RATING
343rd/ 347
METRIC RANK
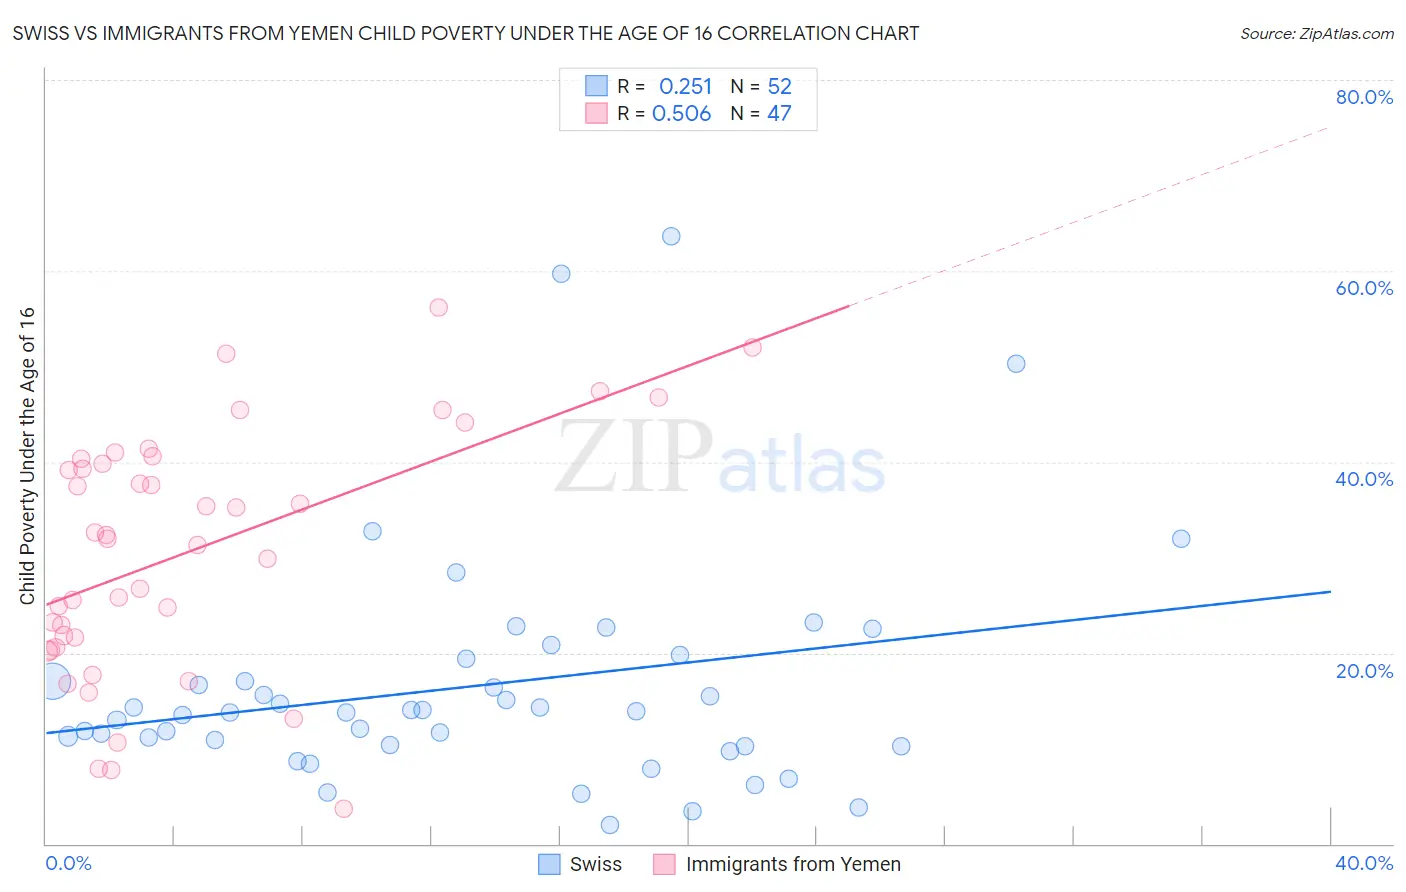
Swiss vs Immigrants from Yemen Child Poverty Under the Age of 16 Correlation Chart
The statistical analysis conducted on geographies consisting of 458,152,839 people shows a weak positive correlation between the proportion of Swiss and poverty level among children under the age of 16 in the United States with a correlation coefficient (R) of 0.251 and weighted average of 14.5%. Similarly, the statistical analysis conducted on geographies consisting of 82,369,702 people shows a substantial positive correlation between the proportion of Immigrants from Yemen and poverty level among children under the age of 16 in the United States with a correlation coefficient (R) of 0.506 and weighted average of 29.1%, a difference of 101.1%.
Child Poverty Under the Age of 16 Correlation Summary
| Measurement | Swiss | Immigrants from Yemen |
| Minimum | 2.0% | 3.6% |
| Maximum | 63.6% | 56.2% |
| Range | 61.7% | 52.6% |
| Mean | 16.5% | 30.5% |
| Median | 13.8% | 31.9% |
| Interquartile 25% (IQ1) | 10.3% | 20.6% |
| Interquartile 75% (IQ3) | 18.3% | 40.4% |
| Interquartile Range (IQR) | 7.9% | 19.8% |
| Standard Deviation (Sample) | 12.3% | 12.8% |
| Standard Deviation (Population) | 12.2% | 12.7% |
Similar Demographics by Child Poverty Under the Age of 16
Demographics Similar to Swiss by Child Poverty Under the Age of 16
In terms of child poverty under the age of 16, the demographic groups most similar to Swiss are Immigrants from Russia (14.5%, a difference of 0.020%), Immigrants from North Macedonia (14.5%, a difference of 0.070%), Finnish (14.5%, a difference of 0.10%), Immigrants from Canada (14.5%, a difference of 0.13%), and Egyptian (14.5%, a difference of 0.16%).
| Demographics | Rating | Rank | Child Poverty Under the Age of 16 |
| Cambodians | 97.8 /100 | #72 | Exceptional 14.4% |
| Immigrants | Turkey | 97.6 /100 | #73 | Exceptional 14.4% |
| Macedonians | 97.6 /100 | #74 | Exceptional 14.4% |
| Ukrainians | 97.5 /100 | #75 | Exceptional 14.4% |
| Immigrants | Eastern Europe | 97.5 /100 | #76 | Exceptional 14.4% |
| Australians | 97.5 /100 | #77 | Exceptional 14.4% |
| Immigrants | Russia | 97.3 /100 | #78 | Exceptional 14.5% |
| Swiss | 97.3 /100 | #79 | Exceptional 14.5% |
| Immigrants | North Macedonia | 97.2 /100 | #80 | Exceptional 14.5% |
| Finns | 97.2 /100 | #81 | Exceptional 14.5% |
| Immigrants | Canada | 97.2 /100 | #82 | Exceptional 14.5% |
| Egyptians | 97.2 /100 | #83 | Exceptional 14.5% |
| Immigrants | Latvia | 97.1 /100 | #84 | Exceptional 14.5% |
| Soviet Union | 97.1 /100 | #85 | Exceptional 14.5% |
| Immigrants | Argentina | 97.1 /100 | #86 | Exceptional 14.5% |
Demographics Similar to Immigrants from Yemen by Child Poverty Under the Age of 16
In terms of child poverty under the age of 16, the demographic groups most similar to Immigrants from Yemen are Pima (29.0%, a difference of 0.19%), Yuman (28.9%, a difference of 0.46%), Navajo (30.2%, a difference of 4.0%), Lumbee (31.0%, a difference of 6.5%), and Hopi (27.1%, a difference of 7.3%).
| Demographics | Rating | Rank | Child Poverty Under the Age of 16 |
| Immigrants | Dominican Republic | 0.0 /100 | #333 | Tragic 24.0% |
| Blacks/African Americans | 0.0 /100 | #334 | Tragic 24.4% |
| Houma | 0.0 /100 | #335 | Tragic 24.9% |
| Yup'ik | 0.0 /100 | #336 | Tragic 25.1% |
| Sioux | 0.0 /100 | #337 | Tragic 25.2% |
| Cheyenne | 0.0 /100 | #338 | Tragic 25.4% |
| Crow | 0.0 /100 | #339 | Tragic 26.0% |
| Hopi | 0.0 /100 | #340 | Tragic 27.1% |
| Yuman | 0.0 /100 | #341 | Tragic 28.9% |
| Pima | 0.0 /100 | #342 | Tragic 29.0% |
| Immigrants | Yemen | 0.0 /100 | #343 | Tragic 29.1% |
| Navajo | 0.0 /100 | #344 | Tragic 30.2% |
| Lumbee | 0.0 /100 | #345 | Tragic 31.0% |
| Tohono O'odham | 0.0 /100 | #346 | Tragic 31.7% |
| Puerto Ricans | 0.0 /100 | #347 | Tragic 32.5% |