Swiss vs Australian Child Poverty Under the Age of 16
COMPARE
Swiss
Australian
Child Poverty Under the Age of 16
Child Poverty Under the Age of 16 Comparison
Swiss
Australians
14.5%
CHILD POVERTY UNDER THE AGE OF 16
97.3/ 100
METRIC RATING
79th/ 347
METRIC RANK
14.4%
CHILD POVERTY UNDER THE AGE OF 16
97.5/ 100
METRIC RATING
77th/ 347
METRIC RANK
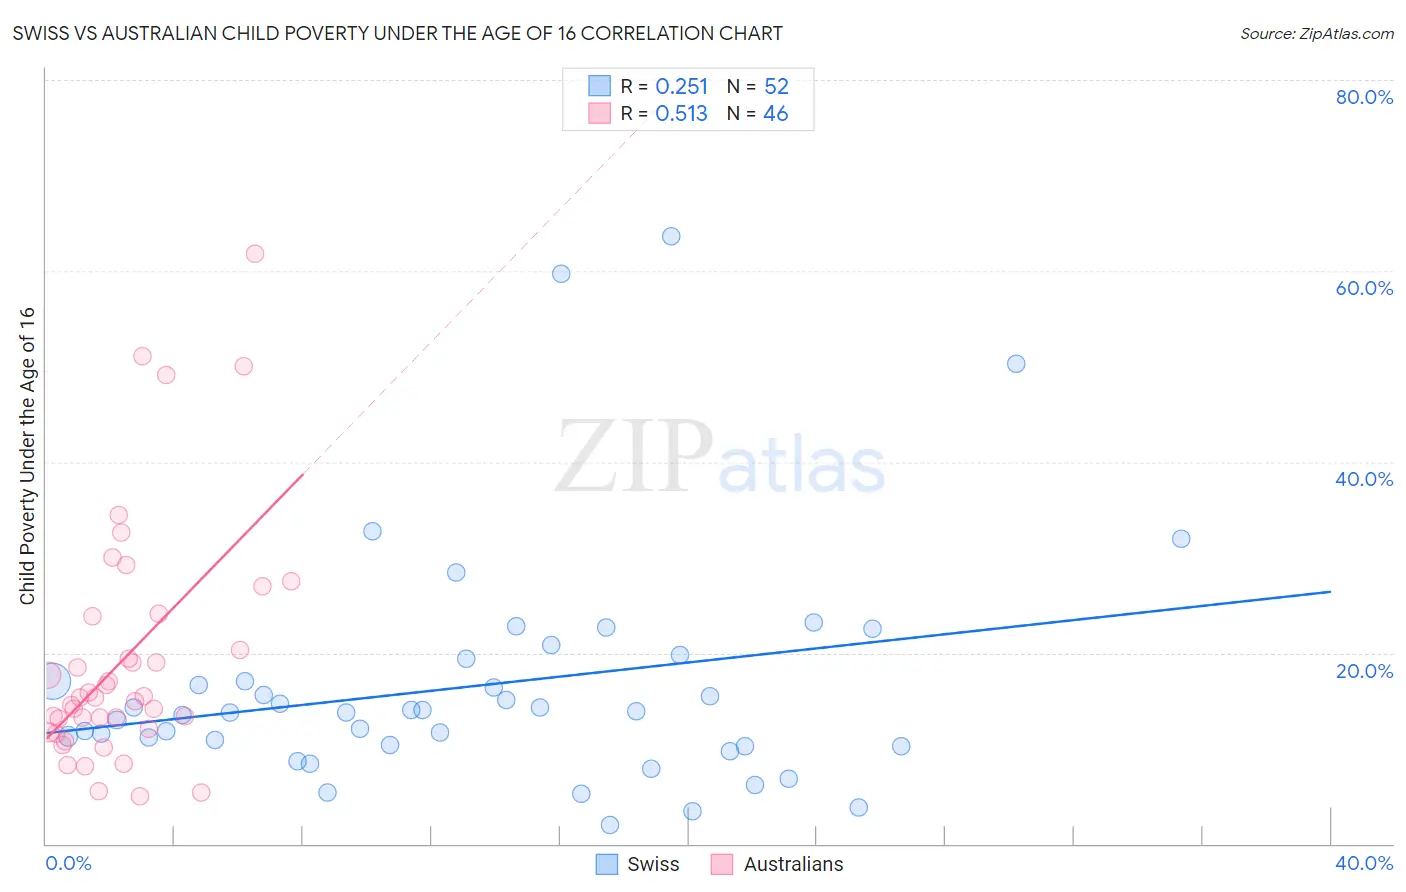
Swiss vs Australian Child Poverty Under the Age of 16 Correlation Chart
The statistical analysis conducted on geographies consisting of 458,152,839 people shows a weak positive correlation between the proportion of Swiss and poverty level among children under the age of 16 in the United States with a correlation coefficient (R) of 0.251 and weighted average of 14.5%. Similarly, the statistical analysis conducted on geographies consisting of 222,609,541 people shows a substantial positive correlation between the proportion of Australians and poverty level among children under the age of 16 in the United States with a correlation coefficient (R) of 0.513 and weighted average of 14.4%, a difference of 0.22%.
Child Poverty Under the Age of 16 Correlation Summary
| Measurement | Swiss | Australian |
| Minimum | 2.0% | 4.9% |
| Maximum | 63.6% | 61.8% |
| Range | 61.7% | 56.9% |
| Mean | 16.5% | 19.4% |
| Median | 13.8% | 15.4% |
| Interquartile 25% (IQ1) | 10.3% | 12.1% |
| Interquartile 75% (IQ3) | 18.3% | 23.8% |
| Interquartile Range (IQR) | 7.9% | 11.7% |
| Standard Deviation (Sample) | 12.3% | 12.6% |
| Standard Deviation (Population) | 12.2% | 12.5% |
Demographics Similar to Swiss and Australians by Child Poverty Under the Age of 16
In terms of child poverty under the age of 16, the demographic groups most similar to Swiss are Immigrants from Russia (14.5%, a difference of 0.020%), Immigrants from North Macedonia (14.5%, a difference of 0.070%), Finnish (14.5%, a difference of 0.10%), Immigrants from Canada (14.5%, a difference of 0.13%), and Egyptian (14.5%, a difference of 0.16%). Similarly, the demographic groups most similar to Australians are Immigrants from Eastern Europe (14.4%, a difference of 0.030%), Ukrainian (14.4%, a difference of 0.040%), Immigrants from Russia (14.5%, a difference of 0.19%), Macedonian (14.4%, a difference of 0.24%), and Immigrants from Turkey (14.4%, a difference of 0.25%).
| Demographics | Rating | Rank | Child Poverty Under the Age of 16 |
| Laotians | 98.0 /100 | #68 | Exceptional 14.3% |
| Immigrants | Bulgaria | 98.0 /100 | #69 | Exceptional 14.3% |
| Immigrants | Netherlands | 97.9 /100 | #70 | Exceptional 14.3% |
| Immigrants | Poland | 97.9 /100 | #71 | Exceptional 14.3% |
| Cambodians | 97.8 /100 | #72 | Exceptional 14.4% |
| Immigrants | Turkey | 97.6 /100 | #73 | Exceptional 14.4% |
| Macedonians | 97.6 /100 | #74 | Exceptional 14.4% |
| Ukrainians | 97.5 /100 | #75 | Exceptional 14.4% |
| Immigrants | Eastern Europe | 97.5 /100 | #76 | Exceptional 14.4% |
| Australians | 97.5 /100 | #77 | Exceptional 14.4% |
| Immigrants | Russia | 97.3 /100 | #78 | Exceptional 14.5% |
| Swiss | 97.3 /100 | #79 | Exceptional 14.5% |
| Immigrants | North Macedonia | 97.2 /100 | #80 | Exceptional 14.5% |
| Finns | 97.2 /100 | #81 | Exceptional 14.5% |
| Immigrants | Canada | 97.2 /100 | #82 | Exceptional 14.5% |
| Egyptians | 97.2 /100 | #83 | Exceptional 14.5% |
| Immigrants | Latvia | 97.1 /100 | #84 | Exceptional 14.5% |
| Soviet Union | 97.1 /100 | #85 | Exceptional 14.5% |
| Immigrants | Argentina | 97.1 /100 | #86 | Exceptional 14.5% |
| Taiwanese | 97.1 /100 | #87 | Exceptional 14.5% |
| Northern Europeans | 97.0 /100 | #88 | Exceptional 14.5% |