Korean vs Zimbabwean Child Poverty Under the Age of 16
COMPARE
Korean
Zimbabwean
Child Poverty Under the Age of 16
Child Poverty Under the Age of 16 Comparison
Koreans
Zimbabweans
13.9%
CHILD POVERTY UNDER THE AGE OF 16
99.2/ 100
METRIC RATING
48th/ 347
METRIC RANK
14.2%
CHILD POVERTY UNDER THE AGE OF 16
98.5/ 100
METRIC RATING
62nd/ 347
METRIC RANK
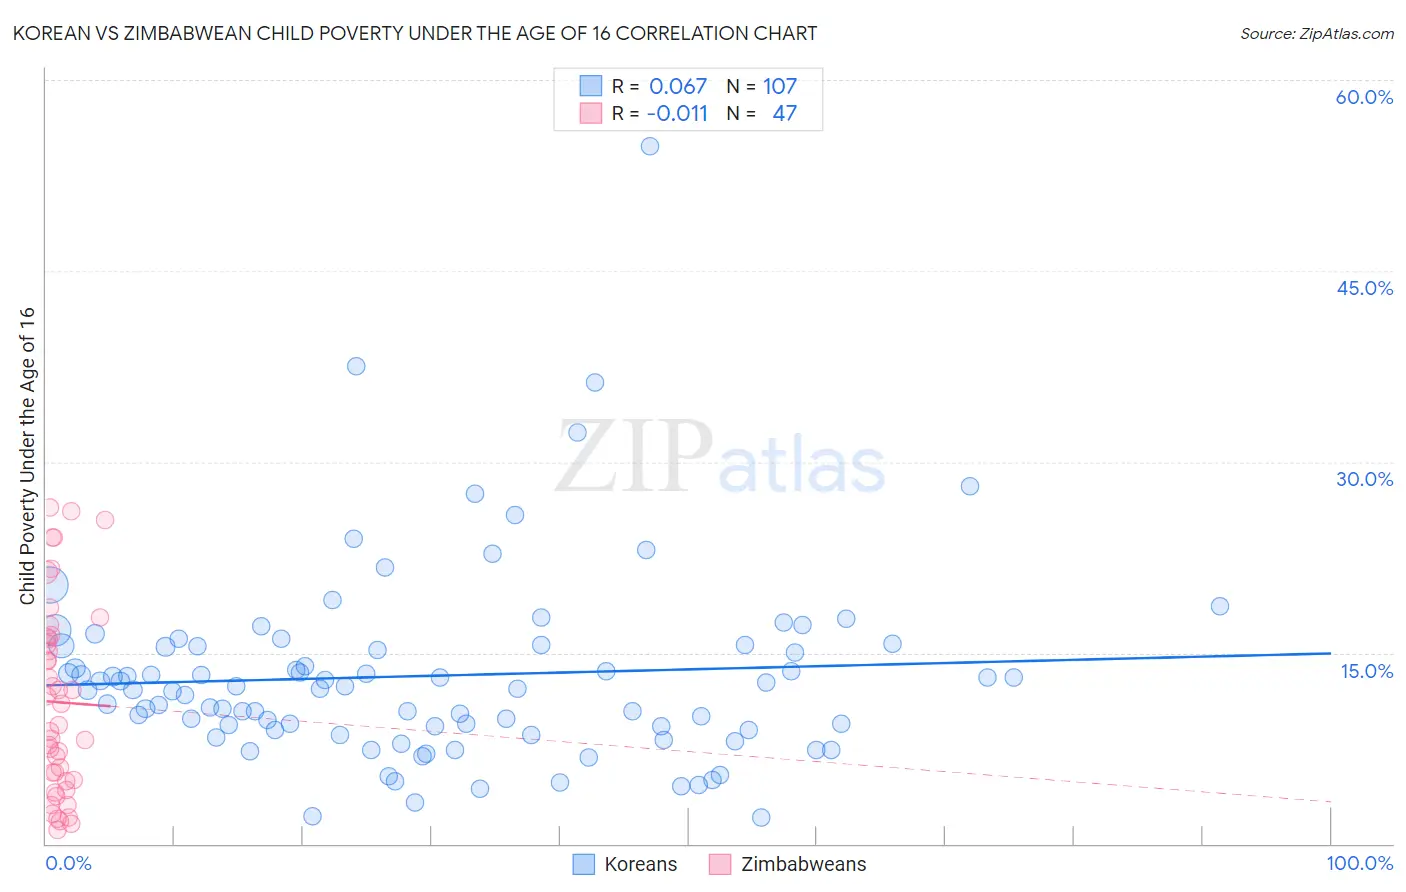
Korean vs Zimbabwean Child Poverty Under the Age of 16 Correlation Chart
The statistical analysis conducted on geographies consisting of 503,868,115 people shows a slight positive correlation between the proportion of Koreans and poverty level among children under the age of 16 in the United States with a correlation coefficient (R) of 0.067 and weighted average of 13.9%. Similarly, the statistical analysis conducted on geographies consisting of 69,119,153 people shows no correlation between the proportion of Zimbabweans and poverty level among children under the age of 16 in the United States with a correlation coefficient (R) of -0.011 and weighted average of 14.2%, a difference of 2.1%.
Child Poverty Under the Age of 16 Correlation Summary
| Measurement | Korean | Zimbabwean |
| Minimum | 2.1% | 1.0% |
| Maximum | 54.8% | 26.5% |
| Range | 52.7% | 25.4% |
| Mean | 13.2% | 11.1% |
| Median | 12.2% | 9.4% |
| Interquartile 25% (IQ1) | 9.0% | 4.9% |
| Interquartile 75% (IQ3) | 15.5% | 16.2% |
| Interquartile Range (IQR) | 6.6% | 11.3% |
| Standard Deviation (Sample) | 7.6% | 7.4% |
| Standard Deviation (Population) | 7.5% | 7.4% |
Demographics Similar to Koreans and Zimbabweans by Child Poverty Under the Age of 16
In terms of child poverty under the age of 16, the demographic groups most similar to Koreans are Italian (13.9%, a difference of 0.030%), Estonian (13.9%, a difference of 0.060%), Immigrants from Asia (13.8%, a difference of 0.22%), Immigrants from Czechoslovakia (13.9%, a difference of 0.26%), and Immigrants from Greece (13.9%, a difference of 0.38%). Similarly, the demographic groups most similar to Zimbabweans are Immigrants from Sweden (14.2%, a difference of 0.010%), Immigrants from Austria (14.2%, a difference of 0.050%), Scandinavian (14.1%, a difference of 0.23%), Immigrants from Pakistan (14.1%, a difference of 0.25%), and Immigrants from Belgium (14.1%, a difference of 0.27%).
| Demographics | Rating | Rank | Child Poverty Under the Age of 16 |
| Czechs | 99.3 /100 | #45 | Exceptional 13.8% |
| Immigrants | Asia | 99.2 /100 | #46 | Exceptional 13.8% |
| Estonians | 99.2 /100 | #47 | Exceptional 13.9% |
| Koreans | 99.2 /100 | #48 | Exceptional 13.9% |
| Italians | 99.2 /100 | #49 | Exceptional 13.9% |
| Immigrants | Czechoslovakia | 99.1 /100 | #50 | Exceptional 13.9% |
| Immigrants | Greece | 99.1 /100 | #51 | Exceptional 13.9% |
| Poles | 98.9 /100 | #52 | Exceptional 14.0% |
| Immigrants | Israel | 98.8 /100 | #53 | Exceptional 14.1% |
| Tsimshian | 98.8 /100 | #54 | Exceptional 14.1% |
| Immigrants | Indonesia | 98.7 /100 | #55 | Exceptional 14.1% |
| Immigrants | Serbia | 98.7 /100 | #56 | Exceptional 14.1% |
| Immigrants | Belgium | 98.6 /100 | #57 | Exceptional 14.1% |
| Immigrants | Pakistan | 98.6 /100 | #58 | Exceptional 14.1% |
| Scandinavians | 98.6 /100 | #59 | Exceptional 14.1% |
| Immigrants | Austria | 98.5 /100 | #60 | Exceptional 14.2% |
| Immigrants | Sweden | 98.5 /100 | #61 | Exceptional 14.2% |
| Zimbabweans | 98.5 /100 | #62 | Exceptional 14.2% |
| Immigrants | Europe | 98.4 /100 | #63 | Exceptional 14.2% |
| Immigrants | Romania | 98.3 /100 | #64 | Exceptional 14.2% |
| Immigrants | Philippines | 98.2 /100 | #65 | Exceptional 14.3% |