Swiss vs Native Hawaiian Single Female Poverty
COMPARE
Swiss
Native Hawaiian
Single Female Poverty
Single Female Poverty Comparison
Swiss
Native Hawaiians
21.4%
SINGLE FEMALE POVERTY
24.2/ 100
METRIC RATING
198th/ 347
METRIC RANK
19.9%
SINGLE FEMALE POVERTY
96.6/ 100
METRIC RATING
108th/ 347
METRIC RANK
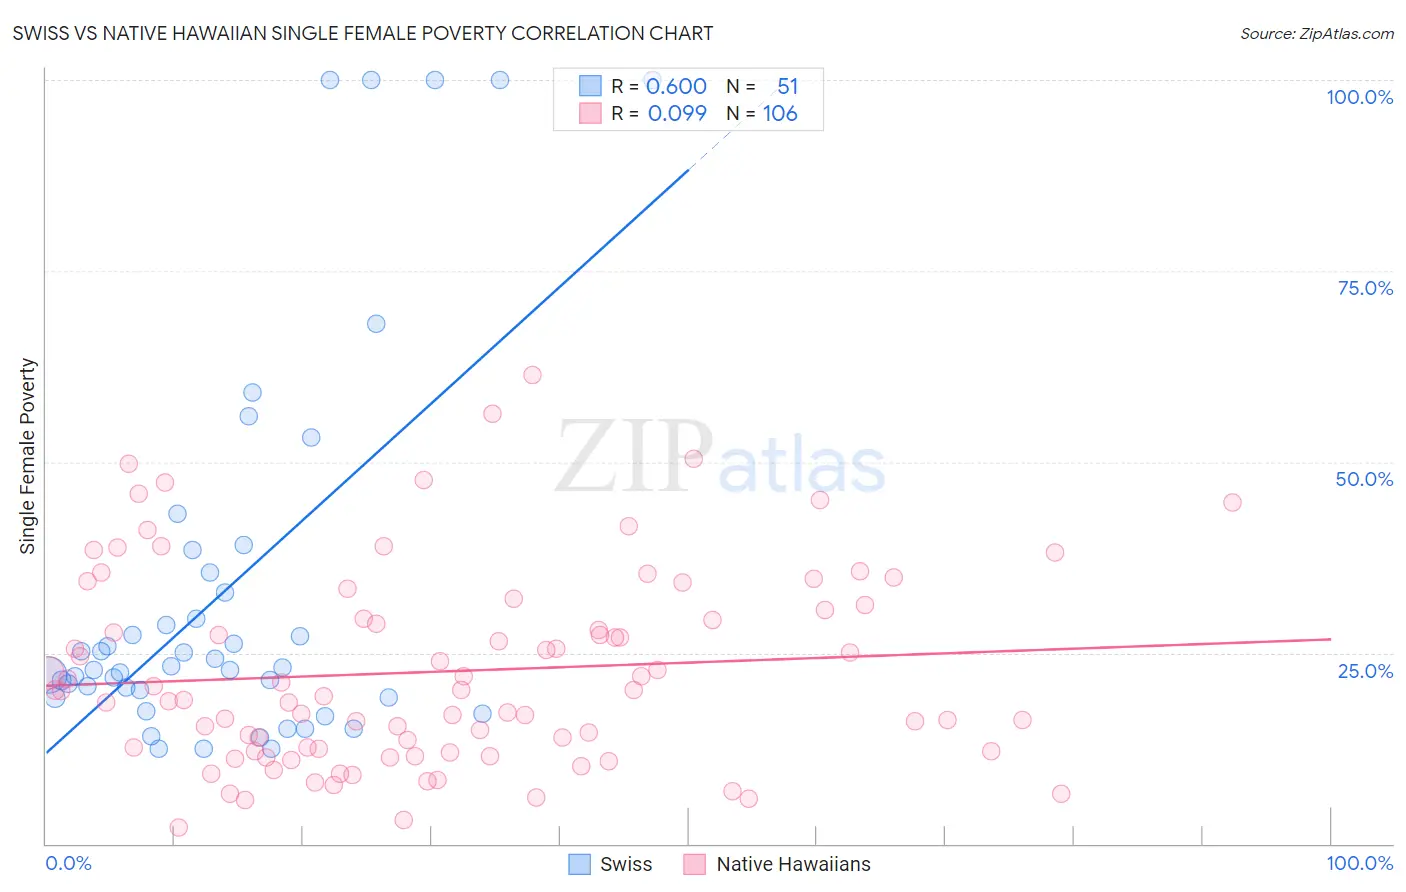
Swiss vs Native Hawaiian Single Female Poverty Correlation Chart
The statistical analysis conducted on geographies consisting of 453,637,180 people shows a substantial positive correlation between the proportion of Swiss and poverty level among single females in the United States with a correlation coefficient (R) of 0.600 and weighted average of 21.4%. Similarly, the statistical analysis conducted on geographies consisting of 328,771,814 people shows a slight positive correlation between the proportion of Native Hawaiians and poverty level among single females in the United States with a correlation coefficient (R) of 0.099 and weighted average of 19.9%, a difference of 7.3%.
Single Female Poverty Correlation Summary
| Measurement | Swiss | Native Hawaiian |
| Minimum | 12.5% | 2.1% |
| Maximum | 100.0% | 61.4% |
| Range | 87.5% | 59.3% |
| Mean | 33.2% | 22.5% |
| Median | 23.1% | 20.0% |
| Interquartile 25% (IQ1) | 19.2% | 12.1% |
| Interquartile 75% (IQ3) | 35.5% | 30.6% |
| Interquartile Range (IQR) | 16.3% | 18.4% |
| Standard Deviation (Sample) | 25.2% | 12.8% |
| Standard Deviation (Population) | 25.0% | 12.8% |
Similar Demographics by Single Female Poverty
Demographics Similar to Swiss by Single Female Poverty
In terms of single female poverty, the demographic groups most similar to Swiss are Japanese (21.3%, a difference of 0.17%), Immigrants (21.4%, a difference of 0.19%), Immigrants from Saudi Arabia (21.3%, a difference of 0.23%), Irish (21.4%, a difference of 0.25%), and Nicaraguan (21.3%, a difference of 0.27%).
| Demographics | Rating | Rank | Single Female Poverty |
| Immigrants | Germany | 31.1 /100 | #191 | Fair 21.3% |
| Immigrants | Jamaica | 30.5 /100 | #192 | Fair 21.3% |
| Basques | 28.1 /100 | #193 | Fair 21.3% |
| Czechoslovakians | 27.7 /100 | #194 | Fair 21.3% |
| Nicaraguans | 27.6 /100 | #195 | Fair 21.3% |
| Immigrants | Saudi Arabia | 27.1 /100 | #196 | Fair 21.3% |
| Japanese | 26.4 /100 | #197 | Fair 21.3% |
| Swiss | 24.2 /100 | #198 | Fair 21.4% |
| Immigrants | Immigrants | 22.0 /100 | #199 | Fair 21.4% |
| Irish | 21.4 /100 | #200 | Fair 21.4% |
| Nigerians | 20.9 /100 | #201 | Fair 21.4% |
| Immigrants | Kenya | 20.7 /100 | #202 | Fair 21.4% |
| Immigrants | Haiti | 18.8 /100 | #203 | Poor 21.5% |
| Immigrants | Africa | 16.7 /100 | #204 | Poor 21.5% |
| Finns | 16.2 /100 | #205 | Poor 21.5% |
Demographics Similar to Native Hawaiians by Single Female Poverty
In terms of single female poverty, the demographic groups most similar to Native Hawaiians are Colombian (19.9%, a difference of 0.0%), Immigrants from Western Asia (19.9%, a difference of 0.020%), Immigrants from Syria (19.9%, a difference of 0.050%), Ethiopian (19.9%, a difference of 0.070%), and Israeli (19.9%, a difference of 0.16%).
| Demographics | Rating | Rank | Single Female Poverty |
| Immigrants | Belgium | 97.3 /100 | #101 | Exceptional 19.8% |
| Immigrants | Cameroon | 97.3 /100 | #102 | Exceptional 19.8% |
| Immigrants | Southern Europe | 97.1 /100 | #103 | Exceptional 19.9% |
| Chileans | 96.9 /100 | #104 | Exceptional 19.9% |
| Israelis | 96.9 /100 | #105 | Exceptional 19.9% |
| Ethiopians | 96.7 /100 | #106 | Exceptional 19.9% |
| Immigrants | Syria | 96.7 /100 | #107 | Exceptional 19.9% |
| Native Hawaiians | 96.6 /100 | #108 | Exceptional 19.9% |
| Colombians | 96.6 /100 | #109 | Exceptional 19.9% |
| Immigrants | Western Asia | 96.5 /100 | #110 | Exceptional 19.9% |
| Carpatho Rusyns | 96.1 /100 | #111 | Exceptional 20.0% |
| Immigrants | Netherlands | 96.0 /100 | #112 | Exceptional 20.0% |
| Immigrants | Zimbabwe | 95.9 /100 | #113 | Exceptional 20.0% |
| Immigrants | Colombia | 95.9 /100 | #114 | Exceptional 20.0% |
| Immigrants | Northern Africa | 95.8 /100 | #115 | Exceptional 20.0% |