Swiss vs Native Hawaiian 8th Grade
COMPARE
Swiss
Native Hawaiian
8th Grade
8th Grade Comparison
Swiss
Native Hawaiians
97.0%
8TH GRADE
100.0/ 100
METRIC RATING
33rd/ 347
METRIC RANK
96.6%
8TH GRADE
99.7/ 100
METRIC RATING
65th/ 347
METRIC RANK
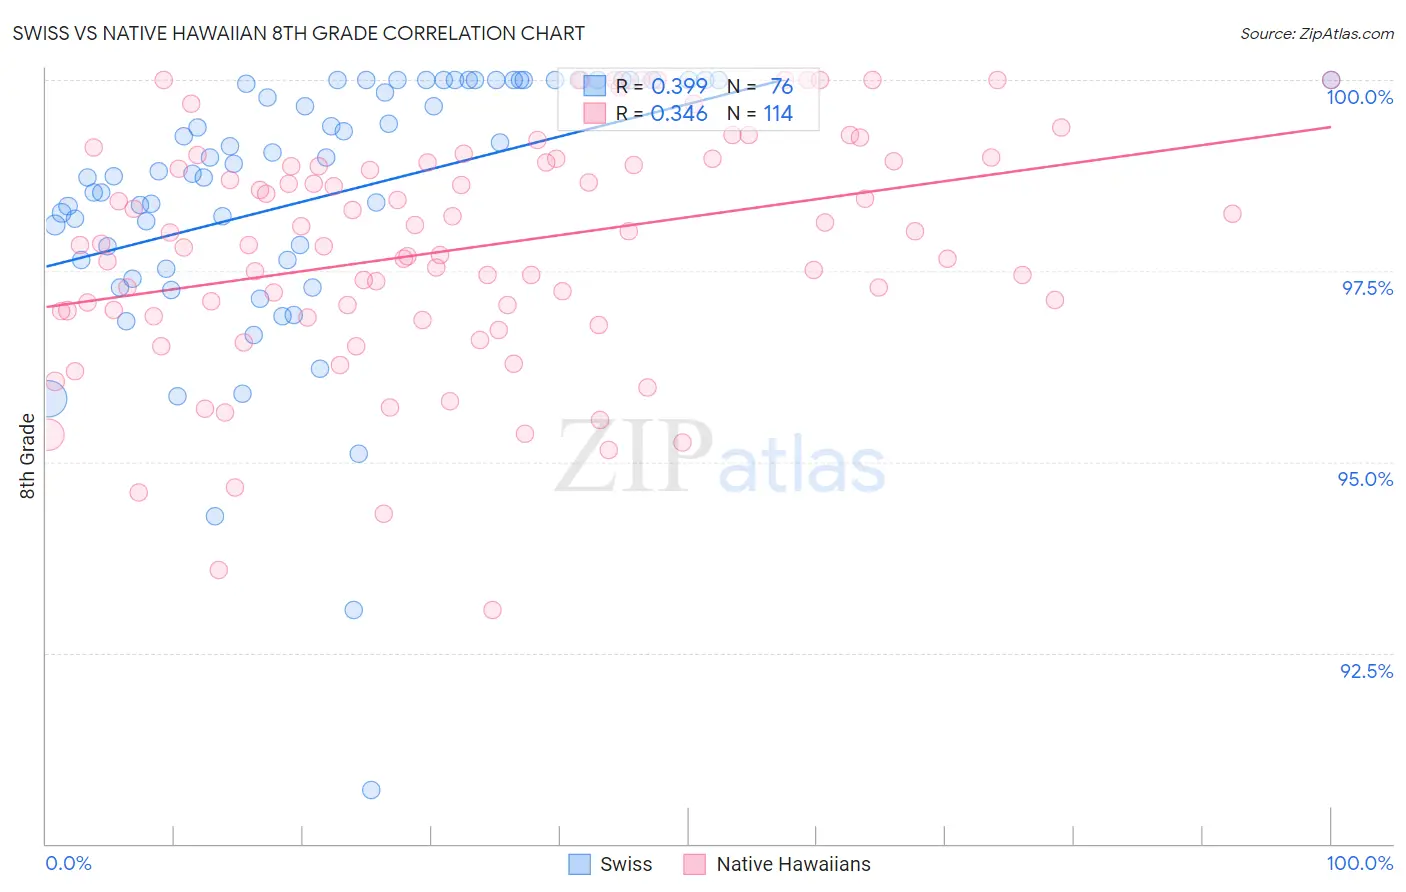
Swiss vs Native Hawaiian 8th Grade Correlation Chart
The statistical analysis conducted on geographies consisting of 465,021,856 people shows a mild positive correlation between the proportion of Swiss and percentage of population with at least 8th grade education in the United States with a correlation coefficient (R) of 0.399 and weighted average of 97.0%. Similarly, the statistical analysis conducted on geographies consisting of 332,101,429 people shows a mild positive correlation between the proportion of Native Hawaiians and percentage of population with at least 8th grade education in the United States with a correlation coefficient (R) of 0.346 and weighted average of 96.6%, a difference of 0.41%.
8th Grade Correlation Summary
| Measurement | Swiss | Native Hawaiian |
| Minimum | 90.7% | 93.1% |
| Maximum | 100.0% | 100.0% |
| Range | 9.3% | 6.9% |
| Mean | 98.5% | 97.8% |
| Median | 98.9% | 97.8% |
| Interquartile 25% (IQ1) | 97.7% | 97.0% |
| Interquartile 75% (IQ3) | 100.0% | 98.9% |
| Interquartile Range (IQR) | 2.3% | 1.9% |
| Standard Deviation (Sample) | 1.8% | 1.5% |
| Standard Deviation (Population) | 1.7% | 1.5% |
Similar Demographics by 8th Grade
Demographics Similar to Swiss by 8th Grade
In terms of 8th grade, the demographic groups most similar to Swiss are Yup'ik (97.0%, a difference of 0.010%), Luxembourger (97.0%, a difference of 0.030%), Sioux (97.1%, a difference of 0.040%), Chippewa (97.1%, a difference of 0.040%), and Alaska Native (97.0%, a difference of 0.040%).
| Demographics | Rating | Rank | 8th Grade |
| French | 100.0 /100 | #26 | Exceptional 97.1% |
| Scotch-Irish | 100.0 /100 | #27 | Exceptional 97.1% |
| Italians | 100.0 /100 | #28 | Exceptional 97.1% |
| Europeans | 100.0 /100 | #29 | Exceptional 97.1% |
| Sioux | 100.0 /100 | #30 | Exceptional 97.1% |
| Chippewa | 100.0 /100 | #31 | Exceptional 97.1% |
| Yup'ik | 100.0 /100 | #32 | Exceptional 97.0% |
| Swiss | 100.0 /100 | #33 | Exceptional 97.0% |
| Luxembourgers | 100.0 /100 | #34 | Exceptional 97.0% |
| Alaska Natives | 100.0 /100 | #35 | Exceptional 97.0% |
| Belgians | 100.0 /100 | #36 | Exceptional 97.0% |
| Latvians | 100.0 /100 | #37 | Exceptional 97.0% |
| British | 100.0 /100 | #38 | Exceptional 97.0% |
| Hungarians | 100.0 /100 | #39 | Exceptional 97.0% |
| Inupiat | 100.0 /100 | #40 | Exceptional 97.0% |
Demographics Similar to Native Hawaiians by 8th Grade
In terms of 8th grade, the demographic groups most similar to Native Hawaiians are Ukrainian (96.7%, a difference of 0.0%), Immigrants from India (96.6%, a difference of 0.0%), Canadian (96.6%, a difference of 0.0%), Iranian (96.6%, a difference of 0.010%), and White/Caucasian (96.7%, a difference of 0.020%).
| Demographics | Rating | Rank | 8th Grade |
| Immigrants | Canada | 99.8 /100 | #58 | Exceptional 96.7% |
| Immigrants | North America | 99.8 /100 | #59 | Exceptional 96.7% |
| Immigrants | Northern Europe | 99.8 /100 | #60 | Exceptional 96.7% |
| Immigrants | Austria | 99.8 /100 | #61 | Exceptional 96.7% |
| Whites/Caucasians | 99.8 /100 | #62 | Exceptional 96.7% |
| Ukrainians | 99.7 /100 | #63 | Exceptional 96.7% |
| Immigrants | India | 99.7 /100 | #64 | Exceptional 96.6% |
| Native Hawaiians | 99.7 /100 | #65 | Exceptional 96.6% |
| Canadians | 99.7 /100 | #66 | Exceptional 96.6% |
| Iranians | 99.7 /100 | #67 | Exceptional 96.6% |
| Creek | 99.7 /100 | #68 | Exceptional 96.6% |
| Americans | 99.7 /100 | #69 | Exceptional 96.6% |
| Immigrants | Lithuania | 99.6 /100 | #70 | Exceptional 96.6% |
| New Zealanders | 99.5 /100 | #71 | Exceptional 96.6% |
| Immigrants | England | 99.5 /100 | #72 | Exceptional 96.6% |