Immigrants from Spain vs Native Hawaiian Single Female Poverty
COMPARE
Immigrants from Spain
Native Hawaiian
Single Female Poverty
Single Female Poverty Comparison
Immigrants from Spain
Native Hawaiians
20.2%
SINGLE FEMALE POVERTY
92.7/ 100
METRIC RATING
128th/ 347
METRIC RANK
19.9%
SINGLE FEMALE POVERTY
96.6/ 100
METRIC RATING
108th/ 347
METRIC RANK
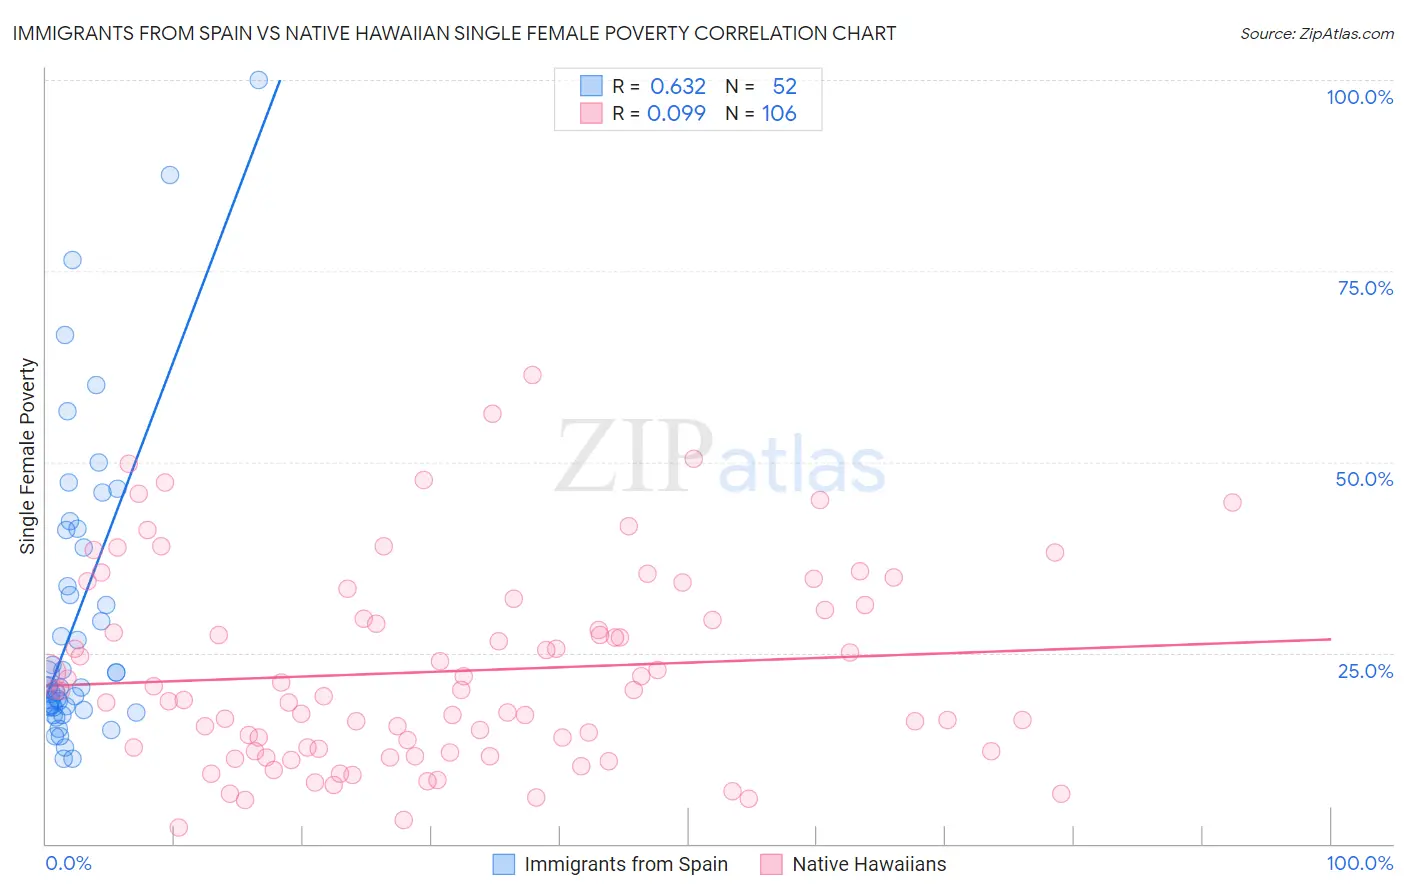
Immigrants from Spain vs Native Hawaiian Single Female Poverty Correlation Chart
The statistical analysis conducted on geographies consisting of 237,218,477 people shows a significant positive correlation between the proportion of Immigrants from Spain and poverty level among single females in the United States with a correlation coefficient (R) of 0.632 and weighted average of 20.2%. Similarly, the statistical analysis conducted on geographies consisting of 328,771,814 people shows a slight positive correlation between the proportion of Native Hawaiians and poverty level among single females in the United States with a correlation coefficient (R) of 0.099 and weighted average of 19.9%, a difference of 1.3%.
Single Female Poverty Correlation Summary
| Measurement | Immigrants from Spain | Native Hawaiian |
| Minimum | 11.2% | 2.1% |
| Maximum | 100.0% | 61.4% |
| Range | 88.8% | 59.3% |
| Mean | 30.0% | 22.5% |
| Median | 20.6% | 20.0% |
| Interquartile 25% (IQ1) | 17.8% | 12.1% |
| Interquartile 75% (IQ3) | 39.9% | 30.6% |
| Interquartile Range (IQR) | 22.0% | 18.4% |
| Standard Deviation (Sample) | 19.8% | 12.8% |
| Standard Deviation (Population) | 19.6% | 12.8% |
Demographics Similar to Immigrants from Spain and Native Hawaiians by Single Female Poverty
In terms of single female poverty, the demographic groups most similar to Immigrants from Spain are Mongolian (20.2%, a difference of 0.11%), Serbian (20.1%, a difference of 0.13%), Immigrants from South Africa (20.1%, a difference of 0.31%), Immigrants from Chile (20.1%, a difference of 0.43%), and Brazilian (20.1%, a difference of 0.46%). Similarly, the demographic groups most similar to Native Hawaiians are Colombian (19.9%, a difference of 0.0%), Immigrants from Western Asia (19.9%, a difference of 0.020%), Carpatho Rusyn (20.0%, a difference of 0.20%), Immigrants from Netherlands (20.0%, a difference of 0.26%), and Immigrants from Zimbabwe (20.0%, a difference of 0.31%).
| Demographics | Rating | Rank | Single Female Poverty |
| Native Hawaiians | 96.6 /100 | #108 | Exceptional 19.9% |
| Colombians | 96.6 /100 | #109 | Exceptional 19.9% |
| Immigrants | Western Asia | 96.5 /100 | #110 | Exceptional 19.9% |
| Carpatho Rusyns | 96.1 /100 | #111 | Exceptional 20.0% |
| Immigrants | Netherlands | 96.0 /100 | #112 | Exceptional 20.0% |
| Immigrants | Zimbabwe | 95.9 /100 | #113 | Exceptional 20.0% |
| Immigrants | Colombia | 95.9 /100 | #114 | Exceptional 20.0% |
| Immigrants | Northern Africa | 95.8 /100 | #115 | Exceptional 20.0% |
| Immigrants | Kazakhstan | 95.7 /100 | #116 | Exceptional 20.0% |
| Poles | 95.6 /100 | #117 | Exceptional 20.0% |
| Immigrants | Afghanistan | 95.4 /100 | #118 | Exceptional 20.0% |
| Immigrants | Ethiopia | 95.4 /100 | #119 | Exceptional 20.0% |
| South Americans | 95.1 /100 | #120 | Exceptional 20.0% |
| Immigrants | Switzerland | 95.1 /100 | #121 | Exceptional 20.0% |
| Immigrants | South America | 95.0 /100 | #122 | Exceptional 20.0% |
| Brazilians | 94.4 /100 | #123 | Exceptional 20.1% |
| Immigrants | Chile | 94.3 /100 | #124 | Exceptional 20.1% |
| Immigrants | South Africa | 93.9 /100 | #125 | Exceptional 20.1% |
| Serbians | 93.3 /100 | #126 | Exceptional 20.1% |
| Mongolians | 93.2 /100 | #127 | Exceptional 20.2% |
| Immigrants | Spain | 92.7 /100 | #128 | Exceptional 20.2% |