Swiss vs Immigrants from Cuba Family Poverty
COMPARE
Swiss
Immigrants from Cuba
Family Poverty
Family Poverty Comparison
Swiss
Immigrants from Cuba
7.7%
FAMILY POVERTY
98.8/ 100
METRIC RATING
53rd/ 347
METRIC RANK
11.3%
FAMILY POVERTY
0.0/ 100
METRIC RATING
282nd/ 347
METRIC RANK
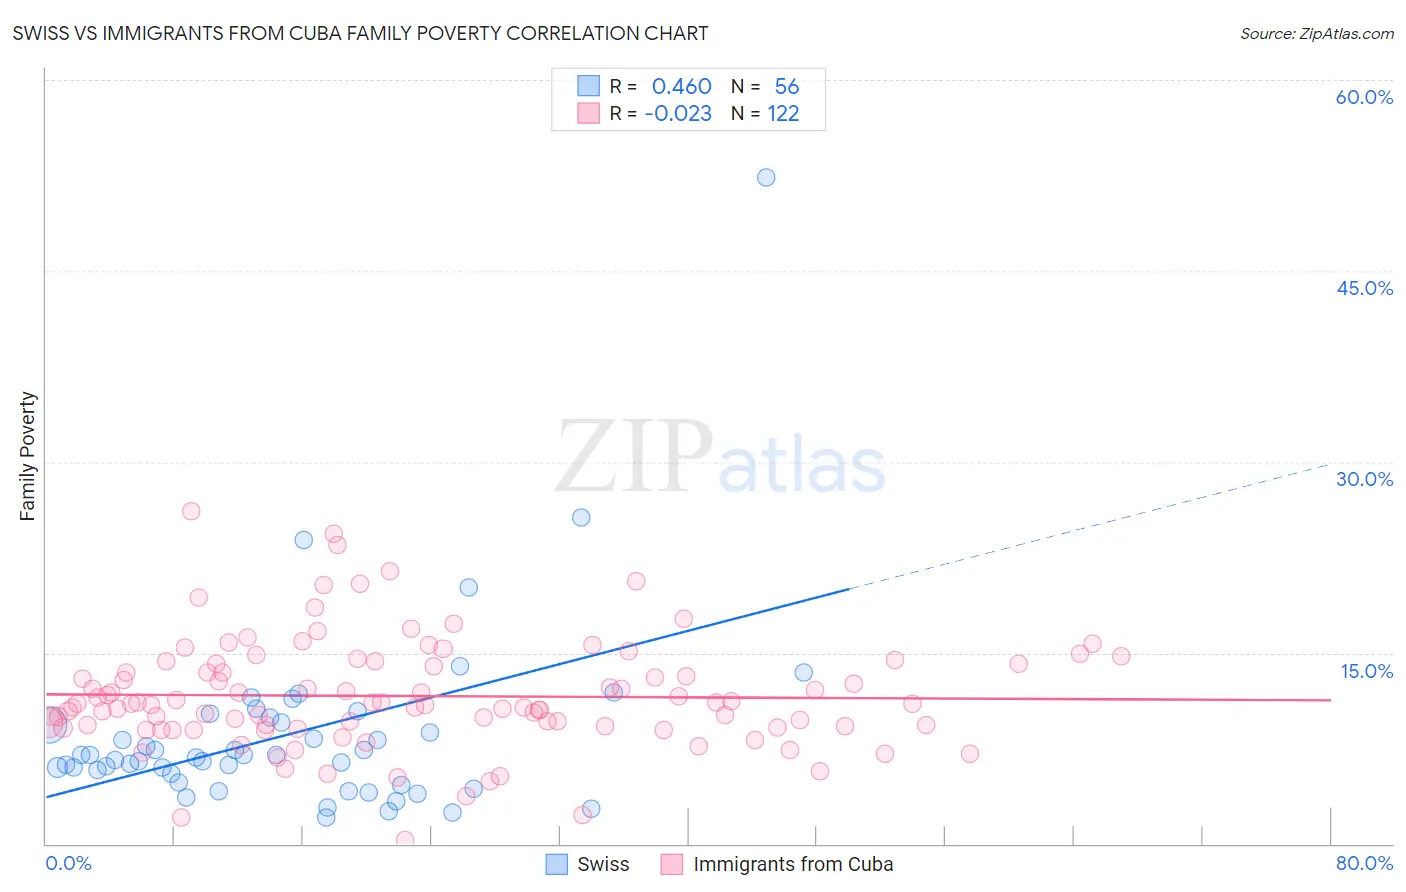
Swiss vs Immigrants from Cuba Family Poverty Correlation Chart
The statistical analysis conducted on geographies consisting of 462,917,875 people shows a moderate positive correlation between the proportion of Swiss and poverty level among families in the United States with a correlation coefficient (R) of 0.460 and weighted average of 7.7%. Similarly, the statistical analysis conducted on geographies consisting of 325,531,975 people shows no correlation between the proportion of Immigrants from Cuba and poverty level among families in the United States with a correlation coefficient (R) of -0.023 and weighted average of 11.3%, a difference of 46.7%.
Family Poverty Correlation Summary
| Measurement | Swiss | Immigrants from Cuba |
| Minimum | 2.1% | 0.31% |
| Maximum | 52.4% | 26.1% |
| Range | 50.3% | 25.8% |
| Mean | 8.6% | 11.6% |
| Median | 6.9% | 11.0% |
| Interquartile 25% (IQ1) | 5.1% | 9.2% |
| Interquartile 75% (IQ3) | 9.7% | 14.1% |
| Interquartile Range (IQR) | 4.6% | 4.9% |
| Standard Deviation (Sample) | 7.6% | 4.3% |
| Standard Deviation (Population) | 7.5% | 4.3% |
Similar Demographics by Family Poverty
Demographics Similar to Swiss by Family Poverty
In terms of family poverty, the demographic groups most similar to Swiss are Immigrants from Sweden (7.7%, a difference of 0.010%), Immigrants from Eastern Asia (7.7%, a difference of 0.040%), Indian (Asian) (7.7%, a difference of 0.060%), Immigrants from Serbia (7.7%, a difference of 0.080%), and Asian (7.7%, a difference of 0.17%).
| Demographics | Rating | Rank | Family Poverty |
| Tongans | 98.9 /100 | #46 | Exceptional 7.7% |
| Immigrants | Czechoslovakia | 98.9 /100 | #47 | Exceptional 7.7% |
| Immigrants | Sri Lanka | 98.9 /100 | #48 | Exceptional 7.7% |
| Immigrants | Bolivia | 98.9 /100 | #49 | Exceptional 7.7% |
| Immigrants | North Macedonia | 98.9 /100 | #50 | Exceptional 7.7% |
| Immigrants | Moldova | 98.8 /100 | #51 | Exceptional 7.7% |
| Indians (Asian) | 98.8 /100 | #52 | Exceptional 7.7% |
| Swiss | 98.8 /100 | #53 | Exceptional 7.7% |
| Immigrants | Sweden | 98.8 /100 | #54 | Exceptional 7.7% |
| Immigrants | Eastern Asia | 98.7 /100 | #55 | Exceptional 7.7% |
| Immigrants | Serbia | 98.7 /100 | #56 | Exceptional 7.7% |
| Asians | 98.7 /100 | #57 | Exceptional 7.7% |
| Finns | 98.7 /100 | #58 | Exceptional 7.7% |
| Europeans | 98.7 /100 | #59 | Exceptional 7.7% |
| Immigrants | Greece | 98.7 /100 | #60 | Exceptional 7.7% |
Demographics Similar to Immigrants from Cuba by Family Poverty
In terms of family poverty, the demographic groups most similar to Immigrants from Cuba are Indonesian (11.3%, a difference of 0.040%), Yaqui (11.3%, a difference of 0.16%), Barbadian (11.3%, a difference of 0.24%), Immigrants from West Indies (11.3%, a difference of 0.26%), and Belizean (11.3%, a difference of 0.53%).
| Demographics | Rating | Rank | Family Poverty |
| Central Americans | 0.1 /100 | #275 | Tragic 11.2% |
| Immigrants | Guyana | 0.1 /100 | #276 | Tragic 11.2% |
| Chippewa | 0.1 /100 | #277 | Tragic 11.2% |
| Guyanese | 0.1 /100 | #278 | Tragic 11.2% |
| Blackfeet | 0.0 /100 | #279 | Tragic 11.3% |
| Belizeans | 0.0 /100 | #280 | Tragic 11.3% |
| Immigrants | West Indies | 0.0 /100 | #281 | Tragic 11.3% |
| Immigrants | Cuba | 0.0 /100 | #282 | Tragic 11.3% |
| Indonesians | 0.0 /100 | #283 | Tragic 11.3% |
| Yaqui | 0.0 /100 | #284 | Tragic 11.3% |
| Barbadians | 0.0 /100 | #285 | Tragic 11.3% |
| Senegalese | 0.0 /100 | #286 | Tragic 11.5% |
| Vietnamese | 0.0 /100 | #287 | Tragic 11.5% |
| Immigrants | Belize | 0.0 /100 | #288 | Tragic 11.5% |
| Immigrants | Barbados | 0.0 /100 | #289 | Tragic 11.5% |