Malaysian vs Australian Child Poverty Under the Age of 16
COMPARE
Malaysian
Australian
Child Poverty Under the Age of 16
Child Poverty Under the Age of 16 Comparison
Malaysians
Australians
17.5%
CHILD POVERTY UNDER THE AGE OF 16
5.9/ 100
METRIC RATING
215th/ 347
METRIC RANK
14.4%
CHILD POVERTY UNDER THE AGE OF 16
97.5/ 100
METRIC RATING
77th/ 347
METRIC RANK
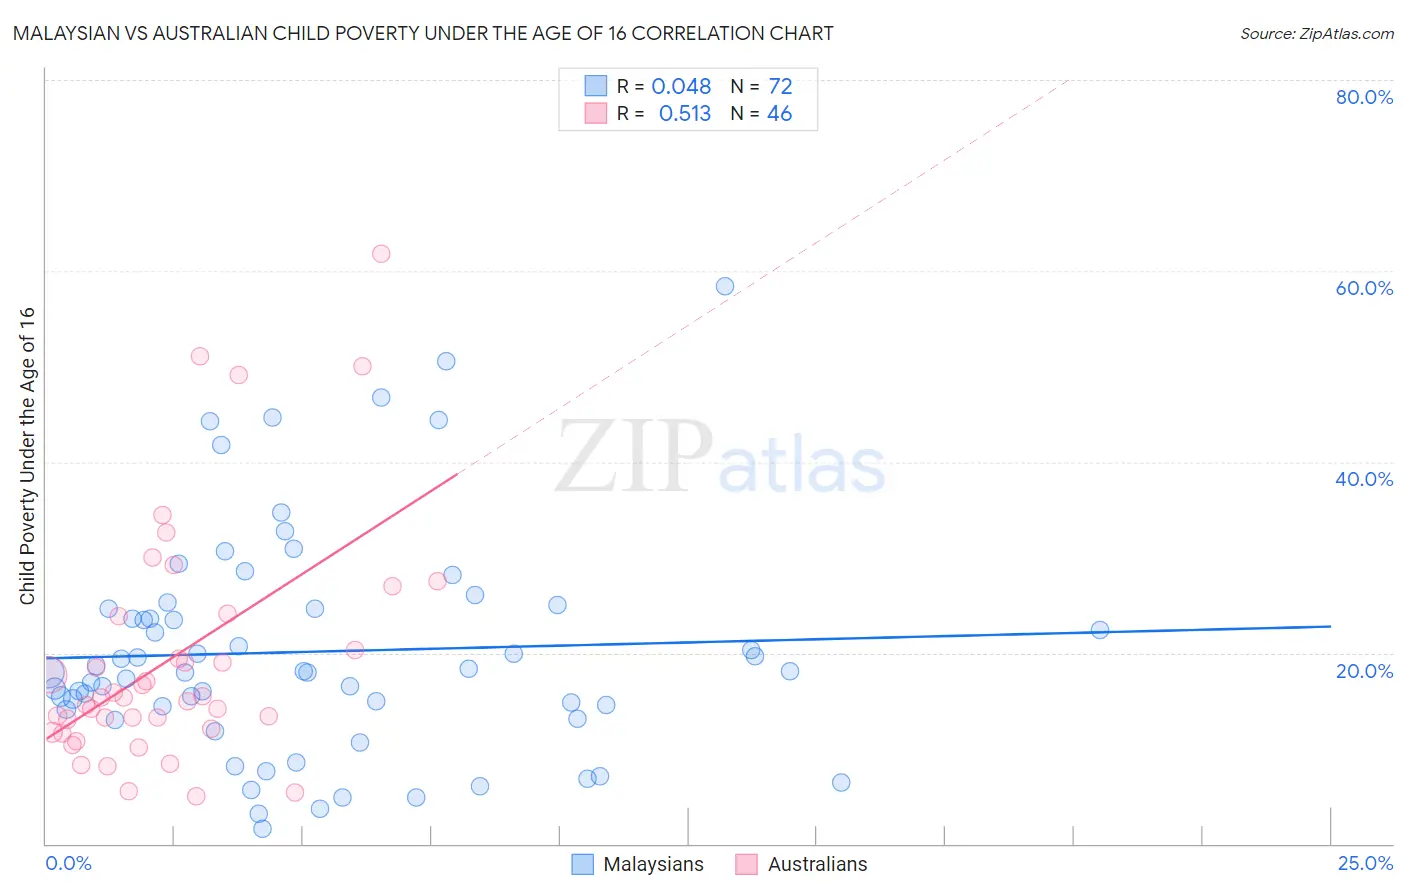
Malaysian vs Australian Child Poverty Under the Age of 16 Correlation Chart
The statistical analysis conducted on geographies consisting of 225,232,766 people shows no correlation between the proportion of Malaysians and poverty level among children under the age of 16 in the United States with a correlation coefficient (R) of 0.048 and weighted average of 17.5%. Similarly, the statistical analysis conducted on geographies consisting of 222,609,541 people shows a substantial positive correlation between the proportion of Australians and poverty level among children under the age of 16 in the United States with a correlation coefficient (R) of 0.513 and weighted average of 14.4%, a difference of 21.6%.
Child Poverty Under the Age of 16 Correlation Summary
| Measurement | Malaysian | Australian |
| Minimum | 1.6% | 4.9% |
| Maximum | 58.3% | 61.8% |
| Range | 56.8% | 56.9% |
| Mean | 20.1% | 19.4% |
| Median | 18.0% | 15.4% |
| Interquartile 25% (IQ1) | 14.2% | 12.1% |
| Interquartile 75% (IQ3) | 24.6% | 23.8% |
| Interquartile Range (IQR) | 10.4% | 11.7% |
| Standard Deviation (Sample) | 11.7% | 12.6% |
| Standard Deviation (Population) | 11.6% | 12.5% |
Similar Demographics by Child Poverty Under the Age of 16
Demographics Similar to Malaysians by Child Poverty Under the Age of 16
In terms of child poverty under the age of 16, the demographic groups most similar to Malaysians are Iraqi (17.5%, a difference of 0.020%), Sierra Leonean (17.6%, a difference of 0.12%), Immigrants from the Azores (17.5%, a difference of 0.14%), Immigrants from Eastern Africa (17.6%, a difference of 0.30%), and Immigrants (17.5%, a difference of 0.31%).
| Demographics | Rating | Rank | Child Poverty Under the Age of 16 |
| Pennsylvania Germans | 7.5 /100 | #208 | Tragic 17.4% |
| Panamanians | 6.9 /100 | #209 | Tragic 17.5% |
| Alaskan Athabascans | 6.9 /100 | #210 | Tragic 17.5% |
| Immigrants | Thailand | 6.6 /100 | #211 | Tragic 17.5% |
| Immigrants | Immigrants | 6.5 /100 | #212 | Tragic 17.5% |
| Immigrants | Azores | 6.2 /100 | #213 | Tragic 17.5% |
| Iraqis | 5.9 /100 | #214 | Tragic 17.5% |
| Malaysians | 5.9 /100 | #215 | Tragic 17.5% |
| Sierra Leoneans | 5.7 /100 | #216 | Tragic 17.6% |
| Immigrants | Eastern Africa | 5.3 /100 | #217 | Tragic 17.6% |
| Moroccans | 5.3 /100 | #218 | Tragic 17.6% |
| Japanese | 4.7 /100 | #219 | Tragic 17.7% |
| Immigrants | Panama | 4.1 /100 | #220 | Tragic 17.7% |
| Cubans | 3.7 /100 | #221 | Tragic 17.8% |
| Immigrants | Armenia | 3.6 /100 | #222 | Tragic 17.8% |
Demographics Similar to Australians by Child Poverty Under the Age of 16
In terms of child poverty under the age of 16, the demographic groups most similar to Australians are Immigrants from Eastern Europe (14.4%, a difference of 0.030%), Ukrainian (14.4%, a difference of 0.040%), Immigrants from Russia (14.5%, a difference of 0.19%), Swiss (14.5%, a difference of 0.22%), and Macedonian (14.4%, a difference of 0.24%).
| Demographics | Rating | Rank | Child Poverty Under the Age of 16 |
| Immigrants | Netherlands | 97.9 /100 | #70 | Exceptional 14.3% |
| Immigrants | Poland | 97.9 /100 | #71 | Exceptional 14.3% |
| Cambodians | 97.8 /100 | #72 | Exceptional 14.4% |
| Immigrants | Turkey | 97.6 /100 | #73 | Exceptional 14.4% |
| Macedonians | 97.6 /100 | #74 | Exceptional 14.4% |
| Ukrainians | 97.5 /100 | #75 | Exceptional 14.4% |
| Immigrants | Eastern Europe | 97.5 /100 | #76 | Exceptional 14.4% |
| Australians | 97.5 /100 | #77 | Exceptional 14.4% |
| Immigrants | Russia | 97.3 /100 | #78 | Exceptional 14.5% |
| Swiss | 97.3 /100 | #79 | Exceptional 14.5% |
| Immigrants | North Macedonia | 97.2 /100 | #80 | Exceptional 14.5% |
| Finns | 97.2 /100 | #81 | Exceptional 14.5% |
| Immigrants | Canada | 97.2 /100 | #82 | Exceptional 14.5% |
| Egyptians | 97.2 /100 | #83 | Exceptional 14.5% |
| Immigrants | Latvia | 97.1 /100 | #84 | Exceptional 14.5% |