Swedish vs Immigrants from Indonesia Female Poverty Among 18-24 Year Olds
COMPARE
Swedish
Immigrants from Indonesia
Female Poverty Among 18-24 Year Olds
Female Poverty Among 18-24 Year Olds Comparison
Swedes
Immigrants from Indonesia
20.1%
FEMALE POVERTY AMONG 18-24 YEAR OLDS
50.0/ 100
METRIC RATING
174th/ 347
METRIC RANK
18.9%
FEMALE POVERTY AMONG 18-24 YEAR OLDS
99.4/ 100
METRIC RATING
83rd/ 347
METRIC RANK
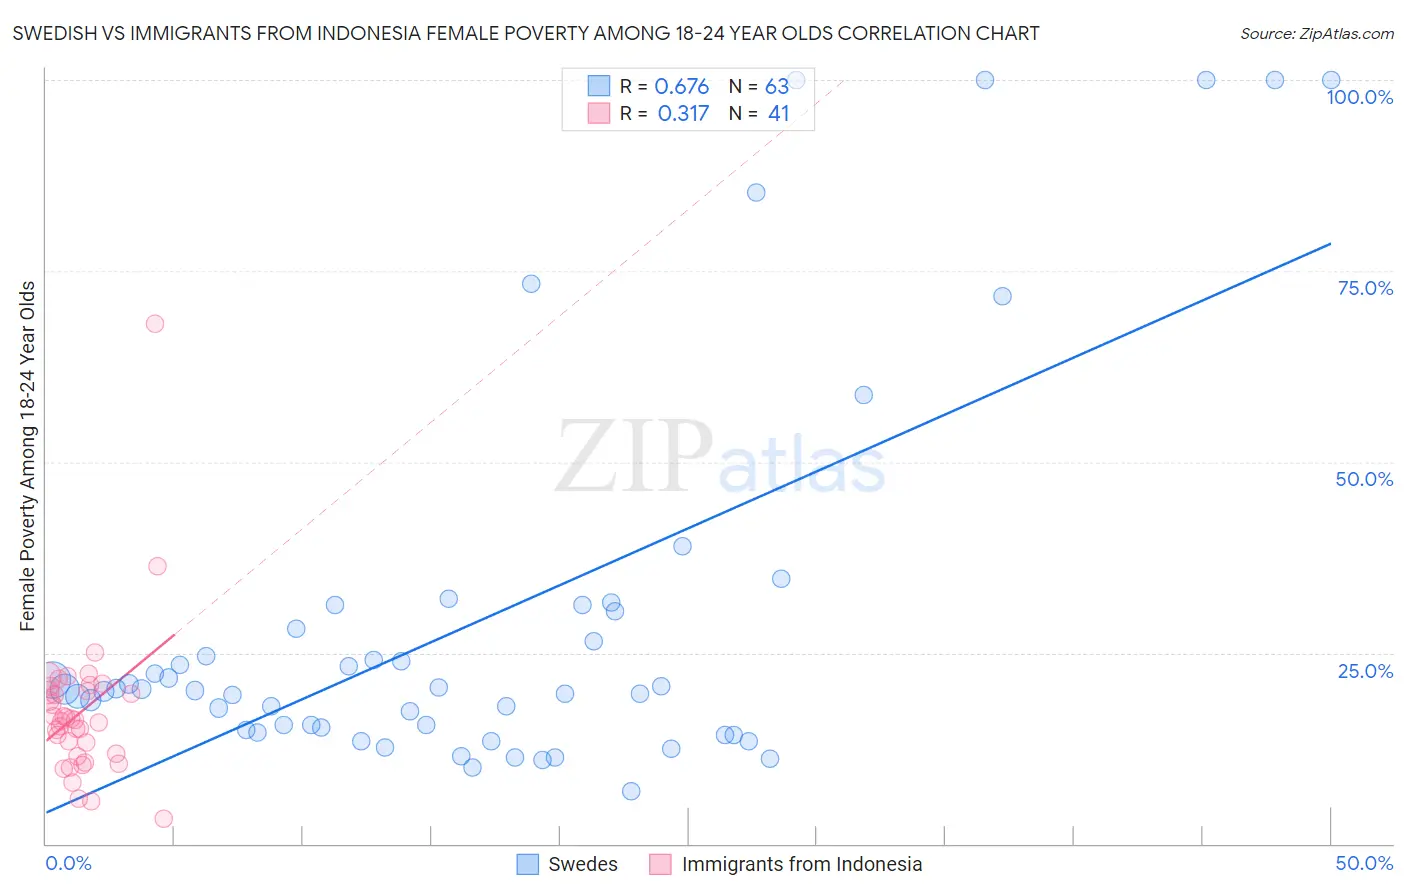
Swedish vs Immigrants from Indonesia Female Poverty Among 18-24 Year Olds Correlation Chart
The statistical analysis conducted on geographies consisting of 510,140,811 people shows a significant positive correlation between the proportion of Swedes and poverty level among females between the ages 18 and 24 in the United States with a correlation coefficient (R) of 0.676 and weighted average of 20.1%. Similarly, the statistical analysis conducted on geographies consisting of 213,252,187 people shows a mild positive correlation between the proportion of Immigrants from Indonesia and poverty level among females between the ages 18 and 24 in the United States with a correlation coefficient (R) of 0.317 and weighted average of 18.9%, a difference of 6.6%.
Female Poverty Among 18-24 Year Olds Correlation Summary
| Measurement | Swedish | Immigrants from Indonesia |
| Minimum | 6.9% | 3.3% |
| Maximum | 100.0% | 68.1% |
| Range | 93.1% | 64.8% |
| Mean | 29.3% | 17.3% |
| Median | 20.2% | 16.2% |
| Interquartile 25% (IQ1) | 14.9% | 11.6% |
| Interquartile 75% (IQ3) | 30.4% | 20.3% |
| Interquartile Range (IQR) | 15.5% | 8.8% |
| Standard Deviation (Sample) | 25.5% | 10.1% |
| Standard Deviation (Population) | 25.3% | 10.0% |
Similar Demographics by Female Poverty Among 18-24 Year Olds
Demographics Similar to Swedes by Female Poverty Among 18-24 Year Olds
In terms of female poverty among 18-24 year olds, the demographic groups most similar to Swedes are Irish (20.1%, a difference of 0.0%), South American Indian (20.1%, a difference of 0.080%), Belizean (20.1%, a difference of 0.10%), Immigrants from Nigeria (20.1%, a difference of 0.21%), and Iranian (20.1%, a difference of 0.23%).
| Demographics | Rating | Rank | Female Poverty Among 18-24 Year Olds |
| Czechoslovakians | 61.8 /100 | #167 | Good 20.0% |
| Fijians | 59.1 /100 | #168 | Average 20.0% |
| Hmong | 55.4 /100 | #169 | Average 20.0% |
| Iranians | 54.7 /100 | #170 | Average 20.1% |
| Immigrants | Nigeria | 54.3 /100 | #171 | Average 20.1% |
| Belizeans | 52.0 /100 | #172 | Average 20.1% |
| Irish | 50.0 /100 | #173 | Average 20.1% |
| Swedes | 50.0 /100 | #174 | Average 20.1% |
| South American Indians | 48.4 /100 | #175 | Average 20.1% |
| Kenyans | 44.9 /100 | #176 | Average 20.2% |
| Immigrants | Kazakhstan | 44.2 /100 | #177 | Average 20.2% |
| Swiss | 44.0 /100 | #178 | Average 20.2% |
| Ethiopians | 43.8 /100 | #179 | Average 20.2% |
| Iraqis | 43.3 /100 | #180 | Average 20.2% |
| Immigrants | China | 43.0 /100 | #181 | Average 20.2% |
Demographics Similar to Immigrants from Indonesia by Female Poverty Among 18-24 Year Olds
In terms of female poverty among 18-24 year olds, the demographic groups most similar to Immigrants from Indonesia are Immigrants from Uruguay (18.8%, a difference of 0.090%), Japanese (18.8%, a difference of 0.19%), Palestinian (18.8%, a difference of 0.20%), Uruguayan (18.8%, a difference of 0.27%), and Costa Rican (18.8%, a difference of 0.28%).
| Demographics | Rating | Rank | Female Poverty Among 18-24 Year Olds |
| Immigrants | Cambodia | 99.5 /100 | #76 | Exceptional 18.8% |
| Costa Ricans | 99.5 /100 | #77 | Exceptional 18.8% |
| Immigrants | Europe | 99.5 /100 | #78 | Exceptional 18.8% |
| Uruguayans | 99.5 /100 | #79 | Exceptional 18.8% |
| Palestinians | 99.5 /100 | #80 | Exceptional 18.8% |
| Japanese | 99.5 /100 | #81 | Exceptional 18.8% |
| Immigrants | Uruguay | 99.4 /100 | #82 | Exceptional 18.8% |
| Immigrants | Indonesia | 99.4 /100 | #83 | Exceptional 18.9% |
| Burmese | 99.2 /100 | #84 | Exceptional 18.9% |
| Immigrants | Armenia | 99.2 /100 | #85 | Exceptional 18.9% |
| Immigrants | Iraq | 99.2 /100 | #86 | Exceptional 18.9% |
| Immigrants | Jamaica | 99.2 /100 | #87 | Exceptional 18.9% |
| Croatians | 99.1 /100 | #88 | Exceptional 19.0% |
| Immigrants | Cabo Verde | 99.0 /100 | #89 | Exceptional 19.0% |
| Afghans | 99.0 /100 | #90 | Exceptional 19.0% |