Swedish vs Mexican Female Poverty Among 18-24 Year Olds
COMPARE
Swedish
Mexican
Female Poverty Among 18-24 Year Olds
Female Poverty Among 18-24 Year Olds Comparison
Swedes
Mexicans
20.1%
FEMALE POVERTY AMONG 18-24 YEAR OLDS
50.0/ 100
METRIC RATING
174th/ 347
METRIC RANK
20.5%
FEMALE POVERTY AMONG 18-24 YEAR OLDS
18.3/ 100
METRIC RATING
201st/ 347
METRIC RANK
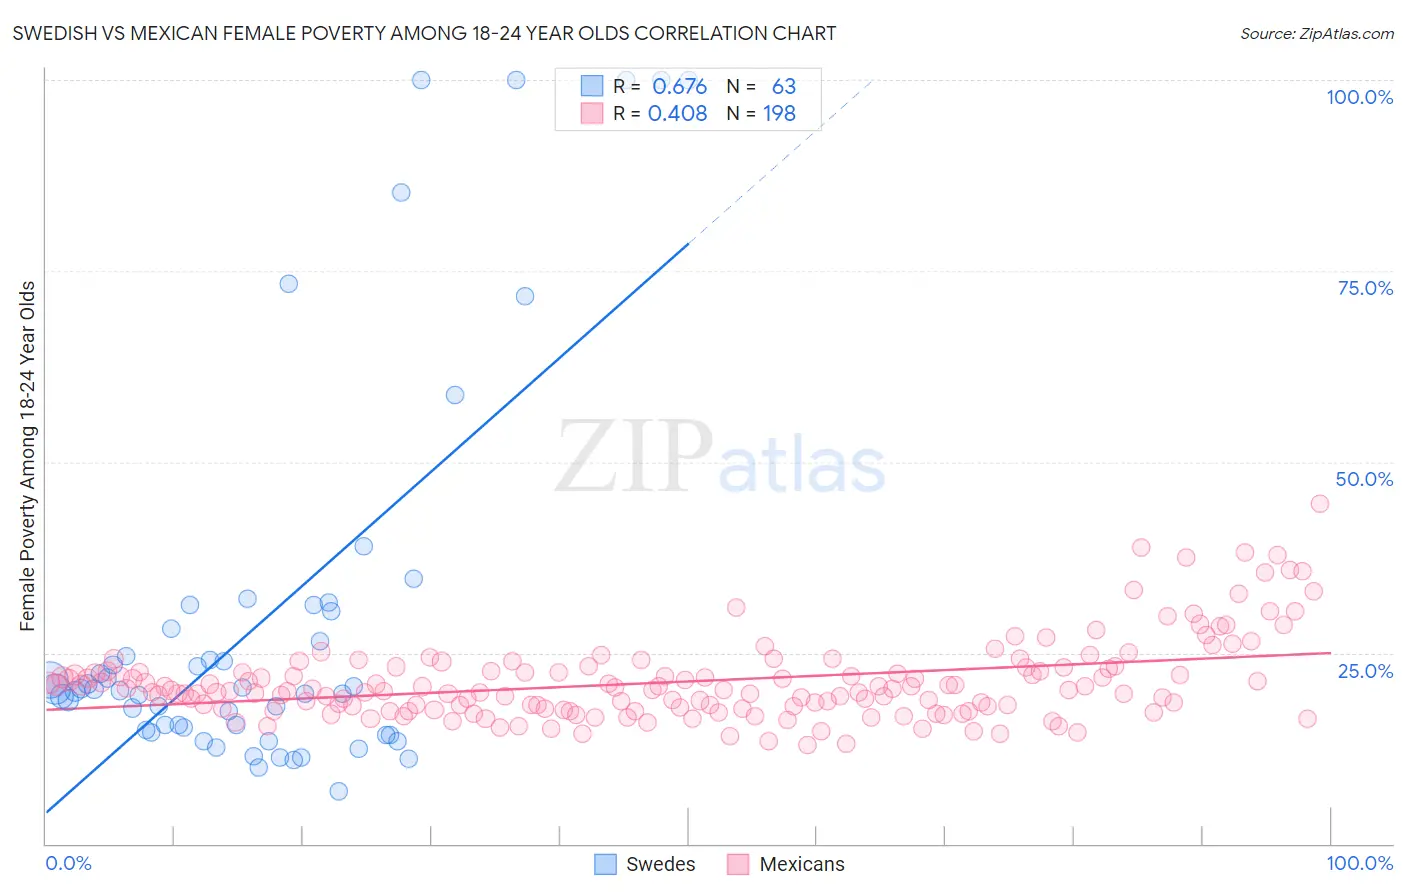
Swedish vs Mexican Female Poverty Among 18-24 Year Olds Correlation Chart
The statistical analysis conducted on geographies consisting of 510,140,811 people shows a significant positive correlation between the proportion of Swedes and poverty level among females between the ages 18 and 24 in the United States with a correlation coefficient (R) of 0.676 and weighted average of 20.1%. Similarly, the statistical analysis conducted on geographies consisting of 535,224,564 people shows a moderate positive correlation between the proportion of Mexicans and poverty level among females between the ages 18 and 24 in the United States with a correlation coefficient (R) of 0.408 and weighted average of 20.5%, a difference of 1.8%.
Female Poverty Among 18-24 Year Olds Correlation Summary
| Measurement | Swedish | Mexican |
| Minimum | 6.9% | 12.9% |
| Maximum | 100.0% | 44.4% |
| Range | 93.1% | 31.6% |
| Mean | 29.3% | 21.2% |
| Median | 20.2% | 20.1% |
| Interquartile 25% (IQ1) | 14.9% | 17.8% |
| Interquartile 75% (IQ3) | 30.4% | 22.6% |
| Interquartile Range (IQR) | 15.5% | 4.7% |
| Standard Deviation (Sample) | 25.5% | 5.2% |
| Standard Deviation (Population) | 25.3% | 5.2% |
Similar Demographics by Female Poverty Among 18-24 Year Olds
Demographics Similar to Swedes by Female Poverty Among 18-24 Year Olds
In terms of female poverty among 18-24 year olds, the demographic groups most similar to Swedes are Irish (20.1%, a difference of 0.0%), South American Indian (20.1%, a difference of 0.080%), Belizean (20.1%, a difference of 0.10%), Immigrants from Nigeria (20.1%, a difference of 0.21%), and Iranian (20.1%, a difference of 0.23%).
| Demographics | Rating | Rank | Female Poverty Among 18-24 Year Olds |
| Czechoslovakians | 61.8 /100 | #167 | Good 20.0% |
| Fijians | 59.1 /100 | #168 | Average 20.0% |
| Hmong | 55.4 /100 | #169 | Average 20.0% |
| Iranians | 54.7 /100 | #170 | Average 20.1% |
| Immigrants | Nigeria | 54.3 /100 | #171 | Average 20.1% |
| Belizeans | 52.0 /100 | #172 | Average 20.1% |
| Irish | 50.0 /100 | #173 | Average 20.1% |
| Swedes | 50.0 /100 | #174 | Average 20.1% |
| South American Indians | 48.4 /100 | #175 | Average 20.1% |
| Kenyans | 44.9 /100 | #176 | Average 20.2% |
| Immigrants | Kazakhstan | 44.2 /100 | #177 | Average 20.2% |
| Swiss | 44.0 /100 | #178 | Average 20.2% |
| Ethiopians | 43.8 /100 | #179 | Average 20.2% |
| Iraqis | 43.3 /100 | #180 | Average 20.2% |
| Immigrants | China | 43.0 /100 | #181 | Average 20.2% |
Demographics Similar to Mexicans by Female Poverty Among 18-24 Year Olds
In terms of female poverty among 18-24 year olds, the demographic groups most similar to Mexicans are Immigrants from Turkey (20.5%, a difference of 0.050%), Immigrants from Malaysia (20.5%, a difference of 0.090%), Immigrants from Netherlands (20.5%, a difference of 0.11%), European (20.4%, a difference of 0.13%), and English (20.5%, a difference of 0.13%).
| Demographics | Rating | Rank | Female Poverty Among 18-24 Year Olds |
| Mexican American Indians | 23.2 /100 | #194 | Fair 20.4% |
| Immigrants | Latvia | 23.0 /100 | #195 | Fair 20.4% |
| Czechs | 22.3 /100 | #196 | Fair 20.4% |
| Zimbabweans | 21.0 /100 | #197 | Fair 20.4% |
| Immigrants | Spain | 20.7 /100 | #198 | Fair 20.4% |
| Germans | 20.6 /100 | #199 | Fair 20.4% |
| Europeans | 19.9 /100 | #200 | Poor 20.4% |
| Mexicans | 18.3 /100 | #201 | Poor 20.5% |
| Immigrants | Turkey | 17.7 /100 | #202 | Poor 20.5% |
| Immigrants | Malaysia | 17.2 /100 | #203 | Poor 20.5% |
| Immigrants | Netherlands | 17.0 /100 | #204 | Poor 20.5% |
| English | 16.7 /100 | #205 | Poor 20.5% |
| Hispanics or Latinos | 16.6 /100 | #206 | Poor 20.5% |
| Spaniards | 16.3 /100 | #207 | Poor 20.5% |
| Dutch | 15.9 /100 | #208 | Poor 20.5% |