Maltese vs Immigrants from Indonesia Female Poverty Among 18-24 Year Olds
COMPARE
Maltese
Immigrants from Indonesia
Female Poverty Among 18-24 Year Olds
Female Poverty Among 18-24 Year Olds Comparison
Maltese
Immigrants from Indonesia
17.6%
FEMALE POVERTY AMONG 18-24 YEAR OLDS
100.0/ 100
METRIC RATING
24th/ 347
METRIC RANK
18.9%
FEMALE POVERTY AMONG 18-24 YEAR OLDS
99.4/ 100
METRIC RATING
83rd/ 347
METRIC RANK
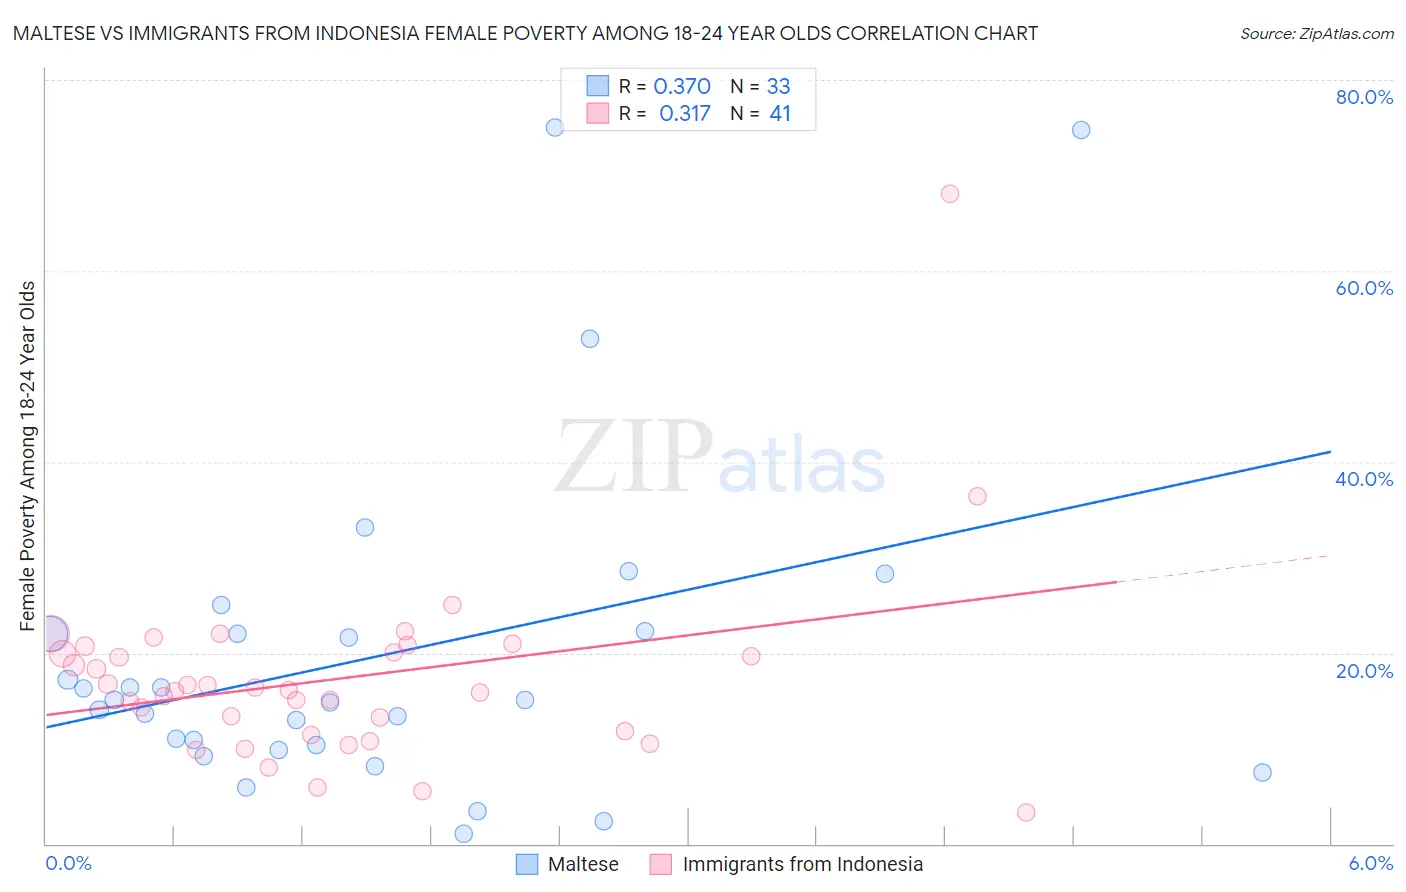
Maltese vs Immigrants from Indonesia Female Poverty Among 18-24 Year Olds Correlation Chart
The statistical analysis conducted on geographies consisting of 124,540,323 people shows a mild positive correlation between the proportion of Maltese and poverty level among females between the ages 18 and 24 in the United States with a correlation coefficient (R) of 0.370 and weighted average of 17.6%. Similarly, the statistical analysis conducted on geographies consisting of 213,252,187 people shows a mild positive correlation between the proportion of Immigrants from Indonesia and poverty level among females between the ages 18 and 24 in the United States with a correlation coefficient (R) of 0.317 and weighted average of 18.9%, a difference of 7.3%.
Female Poverty Among 18-24 Year Olds Correlation Summary
| Measurement | Maltese | Immigrants from Indonesia |
| Minimum | 1.0% | 3.3% |
| Maximum | 75.0% | 68.1% |
| Range | 74.0% | 64.8% |
| Mean | 19.7% | 17.3% |
| Median | 15.0% | 16.2% |
| Interquartile 25% (IQ1) | 10.1% | 11.6% |
| Interquartile 75% (IQ3) | 22.1% | 20.3% |
| Interquartile Range (IQR) | 12.0% | 8.8% |
| Standard Deviation (Sample) | 17.4% | 10.1% |
| Standard Deviation (Population) | 17.1% | 10.0% |
Similar Demographics by Female Poverty Among 18-24 Year Olds
Demographics Similar to Maltese by Female Poverty Among 18-24 Year Olds
In terms of female poverty among 18-24 year olds, the demographic groups most similar to Maltese are Immigrants from North Macedonia (17.6%, a difference of 0.060%), Immigrants from South Central Asia (17.6%, a difference of 0.18%), Immigrants from Fiji (17.7%, a difference of 0.51%), Colombian (17.7%, a difference of 0.61%), and Immigrants from Hong Kong (17.5%, a difference of 0.63%).
| Demographics | Rating | Rank | Female Poverty Among 18-24 Year Olds |
| Immigrants | Taiwan | 100.0 /100 | #17 | Exceptional 17.3% |
| Immigrants | Colombia | 100.0 /100 | #18 | Exceptional 17.3% |
| Immigrants | Lithuania | 100.0 /100 | #19 | Exceptional 17.4% |
| Immigrants | Venezuela | 100.0 /100 | #20 | Exceptional 17.4% |
| Bolivians | 100.0 /100 | #21 | Exceptional 17.4% |
| Immigrants | Hong Kong | 100.0 /100 | #22 | Exceptional 17.5% |
| Immigrants | North Macedonia | 100.0 /100 | #23 | Exceptional 17.6% |
| Maltese | 100.0 /100 | #24 | Exceptional 17.6% |
| Immigrants | South Central Asia | 100.0 /100 | #25 | Exceptional 17.6% |
| Immigrants | Fiji | 100.0 /100 | #26 | Exceptional 17.7% |
| Colombians | 100.0 /100 | #27 | Exceptional 17.7% |
| Venezuelans | 100.0 /100 | #28 | Exceptional 17.7% |
| Portuguese | 100.0 /100 | #29 | Exceptional 17.8% |
| Immigrants | South Eastern Asia | 100.0 /100 | #30 | Exceptional 17.8% |
| Immigrants | Vietnam | 100.0 /100 | #31 | Exceptional 17.8% |
Demographics Similar to Immigrants from Indonesia by Female Poverty Among 18-24 Year Olds
In terms of female poverty among 18-24 year olds, the demographic groups most similar to Immigrants from Indonesia are Immigrants from Uruguay (18.8%, a difference of 0.090%), Japanese (18.8%, a difference of 0.19%), Palestinian (18.8%, a difference of 0.20%), Uruguayan (18.8%, a difference of 0.27%), and Costa Rican (18.8%, a difference of 0.28%).
| Demographics | Rating | Rank | Female Poverty Among 18-24 Year Olds |
| Immigrants | Cambodia | 99.5 /100 | #76 | Exceptional 18.8% |
| Costa Ricans | 99.5 /100 | #77 | Exceptional 18.8% |
| Immigrants | Europe | 99.5 /100 | #78 | Exceptional 18.8% |
| Uruguayans | 99.5 /100 | #79 | Exceptional 18.8% |
| Palestinians | 99.5 /100 | #80 | Exceptional 18.8% |
| Japanese | 99.5 /100 | #81 | Exceptional 18.8% |
| Immigrants | Uruguay | 99.4 /100 | #82 | Exceptional 18.8% |
| Immigrants | Indonesia | 99.4 /100 | #83 | Exceptional 18.9% |
| Burmese | 99.2 /100 | #84 | Exceptional 18.9% |
| Immigrants | Armenia | 99.2 /100 | #85 | Exceptional 18.9% |
| Immigrants | Iraq | 99.2 /100 | #86 | Exceptional 18.9% |
| Immigrants | Jamaica | 99.2 /100 | #87 | Exceptional 18.9% |
| Croatians | 99.1 /100 | #88 | Exceptional 19.0% |
| Immigrants | Cabo Verde | 99.0 /100 | #89 | Exceptional 19.0% |
| Afghans | 99.0 /100 | #90 | Exceptional 19.0% |