Immigrants from Austria vs Immigrants from Indonesia Female Poverty Among 18-24 Year Olds
COMPARE
Immigrants from Austria
Immigrants from Indonesia
Female Poverty Among 18-24 Year Olds
Female Poverty Among 18-24 Year Olds Comparison
Immigrants from Austria
Immigrants from Indonesia
19.7%
FEMALE POVERTY AMONG 18-24 YEAR OLDS
83.1/ 100
METRIC RATING
147th/ 347
METRIC RANK
18.9%
FEMALE POVERTY AMONG 18-24 YEAR OLDS
99.4/ 100
METRIC RATING
83rd/ 347
METRIC RANK
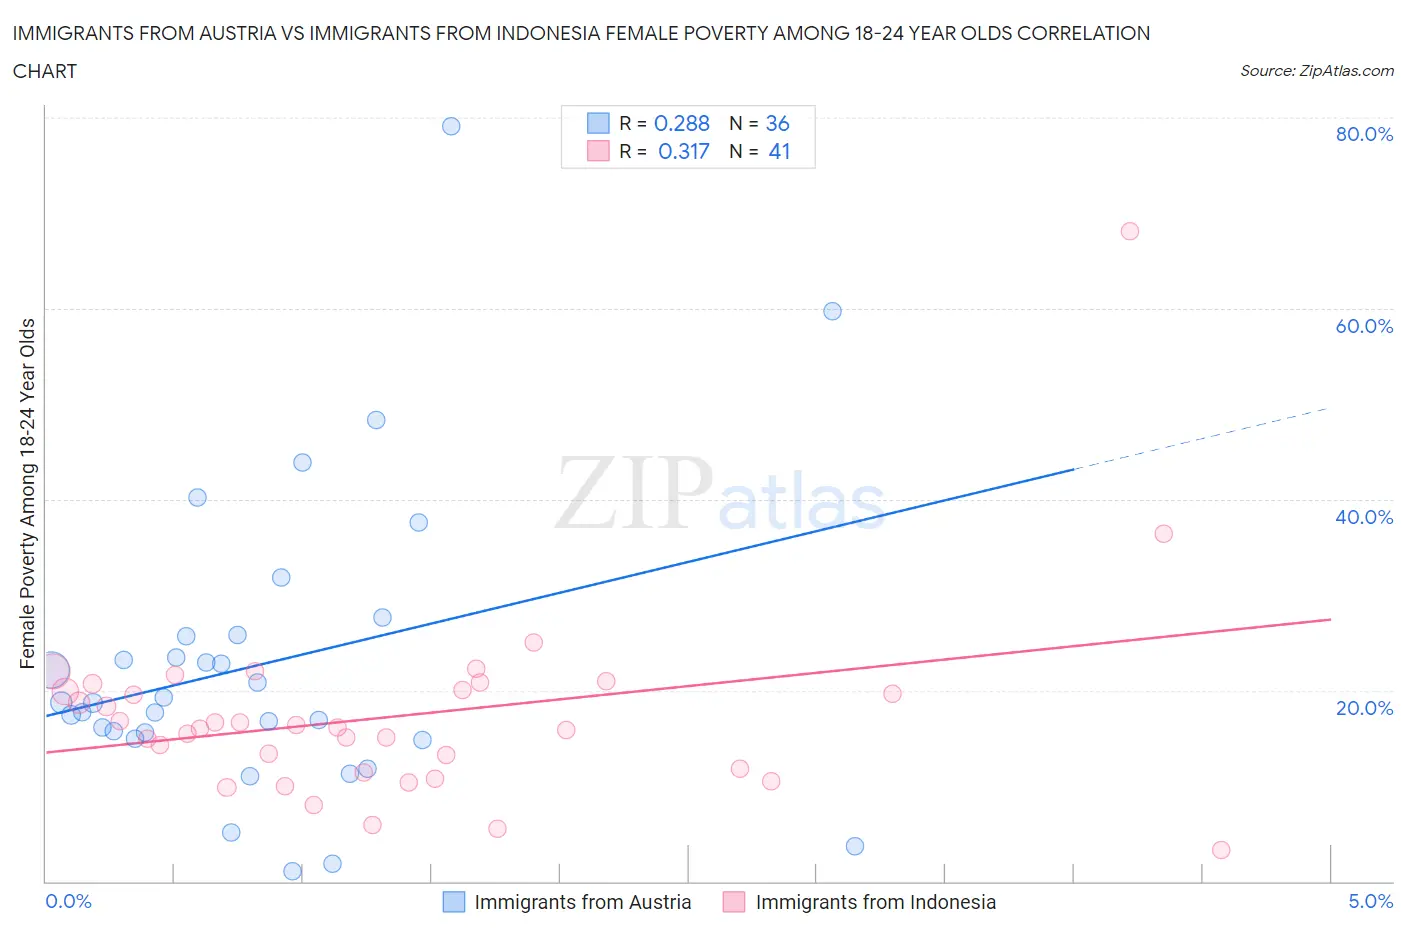
Immigrants from Austria vs Immigrants from Indonesia Female Poverty Among 18-24 Year Olds Correlation Chart
The statistical analysis conducted on geographies consisting of 165,272,500 people shows a weak positive correlation between the proportion of Immigrants from Austria and poverty level among females between the ages 18 and 24 in the United States with a correlation coefficient (R) of 0.288 and weighted average of 19.7%. Similarly, the statistical analysis conducted on geographies consisting of 213,252,187 people shows a mild positive correlation between the proportion of Immigrants from Indonesia and poverty level among females between the ages 18 and 24 in the United States with a correlation coefficient (R) of 0.317 and weighted average of 18.9%, a difference of 4.5%.
Female Poverty Among 18-24 Year Olds Correlation Summary
| Measurement | Immigrants from Austria | Immigrants from Indonesia |
| Minimum | 1.0% | 3.3% |
| Maximum | 79.1% | 68.1% |
| Range | 78.0% | 64.8% |
| Mean | 22.8% | 17.3% |
| Median | 18.7% | 16.2% |
| Interquartile 25% (IQ1) | 15.3% | 11.6% |
| Interquartile 75% (IQ3) | 25.7% | 20.3% |
| Interquartile Range (IQR) | 10.4% | 8.8% |
| Standard Deviation (Sample) | 15.8% | 10.1% |
| Standard Deviation (Population) | 15.6% | 10.0% |
Similar Demographics by Female Poverty Among 18-24 Year Olds
Demographics Similar to Immigrants from Austria by Female Poverty Among 18-24 Year Olds
In terms of female poverty among 18-24 year olds, the demographic groups most similar to Immigrants from Austria are Immigrants from Bosnia and Herzegovina (19.7%, a difference of 0.050%), Canadian (19.7%, a difference of 0.060%), Immigrants from Northern Africa (19.7%, a difference of 0.090%), Slavic (19.7%, a difference of 0.12%), and Panamanian (19.7%, a difference of 0.13%).
| Demographics | Rating | Rank | Female Poverty Among 18-24 Year Olds |
| Immigrants | Trinidad and Tobago | 85.6 /100 | #140 | Excellent 19.7% |
| Pennsylvania Germans | 85.5 /100 | #141 | Excellent 19.7% |
| Panamanians | 84.6 /100 | #142 | Excellent 19.7% |
| Slavs | 84.4 /100 | #143 | Excellent 19.7% |
| Immigrants | Northern Africa | 84.1 /100 | #144 | Excellent 19.7% |
| Canadians | 83.8 /100 | #145 | Excellent 19.7% |
| Immigrants | Bosnia and Herzegovina | 83.6 /100 | #146 | Excellent 19.7% |
| Immigrants | Austria | 83.1 /100 | #147 | Excellent 19.7% |
| Immigrants | Latin America | 81.3 /100 | #148 | Excellent 19.7% |
| Immigrants | Oceania | 81.2 /100 | #149 | Excellent 19.7% |
| Syrians | 80.2 /100 | #150 | Excellent 19.8% |
| Immigrants | Eastern Asia | 79.7 /100 | #151 | Good 19.8% |
| Yugoslavians | 79.0 /100 | #152 | Good 19.8% |
| Immigrants | Japan | 78.1 /100 | #153 | Good 19.8% |
| Immigrants | Zimbabwe | 76.7 /100 | #154 | Good 19.8% |
Demographics Similar to Immigrants from Indonesia by Female Poverty Among 18-24 Year Olds
In terms of female poverty among 18-24 year olds, the demographic groups most similar to Immigrants from Indonesia are Immigrants from Uruguay (18.8%, a difference of 0.090%), Japanese (18.8%, a difference of 0.19%), Palestinian (18.8%, a difference of 0.20%), Uruguayan (18.8%, a difference of 0.27%), and Costa Rican (18.8%, a difference of 0.28%).
| Demographics | Rating | Rank | Female Poverty Among 18-24 Year Olds |
| Immigrants | Cambodia | 99.5 /100 | #76 | Exceptional 18.8% |
| Costa Ricans | 99.5 /100 | #77 | Exceptional 18.8% |
| Immigrants | Europe | 99.5 /100 | #78 | Exceptional 18.8% |
| Uruguayans | 99.5 /100 | #79 | Exceptional 18.8% |
| Palestinians | 99.5 /100 | #80 | Exceptional 18.8% |
| Japanese | 99.5 /100 | #81 | Exceptional 18.8% |
| Immigrants | Uruguay | 99.4 /100 | #82 | Exceptional 18.8% |
| Immigrants | Indonesia | 99.4 /100 | #83 | Exceptional 18.9% |
| Burmese | 99.2 /100 | #84 | Exceptional 18.9% |
| Immigrants | Armenia | 99.2 /100 | #85 | Exceptional 18.9% |
| Immigrants | Iraq | 99.2 /100 | #86 | Exceptional 18.9% |
| Immigrants | Jamaica | 99.2 /100 | #87 | Exceptional 18.9% |
| Croatians | 99.1 /100 | #88 | Exceptional 19.0% |
| Immigrants | Cabo Verde | 99.0 /100 | #89 | Exceptional 19.0% |
| Afghans | 99.0 /100 | #90 | Exceptional 19.0% |