Sudanese vs Tsimshian Child Poverty Among Girls Under 16
COMPARE
Sudanese
Tsimshian
Child Poverty Among Girls Under 16
Child Poverty Among Girls Under 16 Comparison
Sudanese
Tsimshian
18.6%
CHILD POVERTY AMONG GIRLS UNDER 16
1.1/ 100
METRIC RATING
233rd/ 347
METRIC RANK
11.5%
CHILD POVERTY AMONG GIRLS UNDER 16
100.0/ 100
METRIC RATING
4th/ 347
METRIC RANK
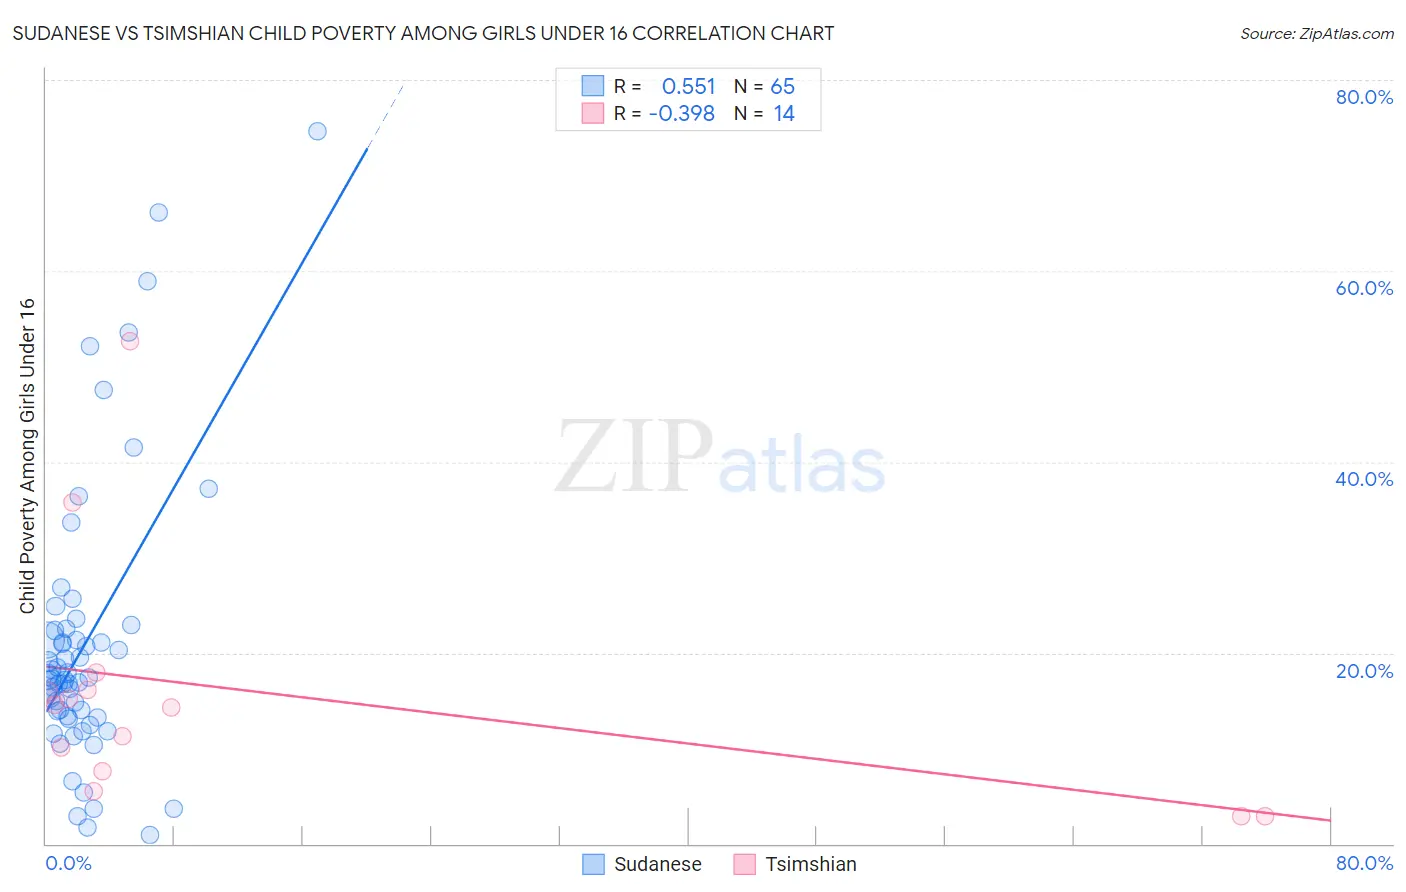
Sudanese vs Tsimshian Child Poverty Among Girls Under 16 Correlation Chart
The statistical analysis conducted on geographies consisting of 109,721,047 people shows a substantial positive correlation between the proportion of Sudanese and poverty level among girls under the age of 16 in the United States with a correlation coefficient (R) of 0.551 and weighted average of 18.6%. Similarly, the statistical analysis conducted on geographies consisting of 15,575,613 people shows a mild negative correlation between the proportion of Tsimshian and poverty level among girls under the age of 16 in the United States with a correlation coefficient (R) of -0.398 and weighted average of 11.5%, a difference of 62.0%.
Child Poverty Among Girls Under 16 Correlation Summary
| Measurement | Sudanese | Tsimshian |
| Minimum | 0.90% | 2.9% |
| Maximum | 74.6% | 52.6% |
| Range | 73.7% | 49.7% |
| Mean | 21.0% | 15.9% |
| Median | 17.3% | 14.4% |
| Interquartile 25% (IQ1) | 13.3% | 7.5% |
| Interquartile 75% (IQ3) | 22.4% | 16.1% |
| Interquartile Range (IQR) | 9.1% | 8.5% |
| Standard Deviation (Sample) | 14.7% | 13.4% |
| Standard Deviation (Population) | 14.5% | 12.9% |
Similar Demographics by Child Poverty Among Girls Under 16
Demographics Similar to Sudanese by Child Poverty Among Girls Under 16
In terms of child poverty among girls under 16, the demographic groups most similar to Sudanese are Immigrants from Sudan (18.6%, a difference of 0.040%), Fijian (18.6%, a difference of 0.070%), Nepalese (18.6%, a difference of 0.12%), Alsatian (18.6%, a difference of 0.13%), and Immigrants from Nigeria (18.6%, a difference of 0.26%).
| Demographics | Rating | Rank | Child Poverty Among Girls Under 16 |
| Nicaraguans | 2.4 /100 | #226 | Tragic 18.2% |
| Immigrants | Nonimmigrants | 2.0 /100 | #227 | Tragic 18.3% |
| Alaskan Athabascans | 2.0 /100 | #228 | Tragic 18.3% |
| Ghanaians | 1.4 /100 | #229 | Tragic 18.5% |
| Osage | 1.3 /100 | #230 | Tragic 18.5% |
| Cree | 1.3 /100 | #231 | Tragic 18.5% |
| Immigrants | Sudan | 1.1 /100 | #232 | Tragic 18.6% |
| Sudanese | 1.1 /100 | #233 | Tragic 18.6% |
| Fijians | 1.1 /100 | #234 | Tragic 18.6% |
| Nepalese | 1.1 /100 | #235 | Tragic 18.6% |
| Alsatians | 1.1 /100 | #236 | Tragic 18.6% |
| Immigrants | Nigeria | 1.0 /100 | #237 | Tragic 18.6% |
| Immigrants | Eritrea | 1.0 /100 | #238 | Tragic 18.7% |
| Marshallese | 0.9 /100 | #239 | Tragic 18.7% |
| Nigerians | 0.9 /100 | #240 | Tragic 18.7% |
Demographics Similar to Tsimshian by Child Poverty Among Girls Under 16
In terms of child poverty among girls under 16, the demographic groups most similar to Tsimshian are Filipino (11.4%, a difference of 0.52%), Immigrants from Taiwan (11.3%, a difference of 1.4%), Thai (11.8%, a difference of 3.0%), Immigrants from India (11.0%, a difference of 4.1%), and Immigrants from Hong Kong (12.3%, a difference of 7.4%).
| Demographics | Rating | Rank | Child Poverty Among Girls Under 16 |
| Immigrants | India | 100.0 /100 | #1 | Exceptional 11.0% |
| Immigrants | Taiwan | 100.0 /100 | #2 | Exceptional 11.3% |
| Filipinos | 100.0 /100 | #3 | Exceptional 11.4% |
| Tsimshian | 100.0 /100 | #4 | Exceptional 11.5% |
| Thais | 100.0 /100 | #5 | Exceptional 11.8% |
| Immigrants | Hong Kong | 100.0 /100 | #6 | Exceptional 12.3% |
| Chinese | 100.0 /100 | #7 | Exceptional 12.3% |
| Iranians | 100.0 /100 | #8 | Exceptional 12.4% |
| Immigrants | Singapore | 100.0 /100 | #9 | Exceptional 12.5% |
| Immigrants | Iran | 100.0 /100 | #10 | Exceptional 12.6% |
| Immigrants | South Central Asia | 100.0 /100 | #11 | Exceptional 12.7% |
| Bhutanese | 100.0 /100 | #12 | Exceptional 12.7% |
| Immigrants | Ireland | 99.9 /100 | #13 | Exceptional 12.9% |
| Burmese | 99.9 /100 | #14 | Exceptional 13.0% |
| Okinawans | 99.9 /100 | #15 | Exceptional 13.0% |