Sudanese vs Tsimshian In Labor Force | Age 25-29
COMPARE
Sudanese
Tsimshian
In Labor Force | Age 25-29
In Labor Force | Age 25-29 Comparison
Sudanese
Tsimshian
85.9%
IN LABOR FORCE | AGE 25-29
100.0/ 100
METRIC RATING
25th/ 347
METRIC RANK
88.7%
IN LABOR FORCE | AGE 25-29
100.0/ 100
METRIC RATING
1st/ 347
METRIC RANK
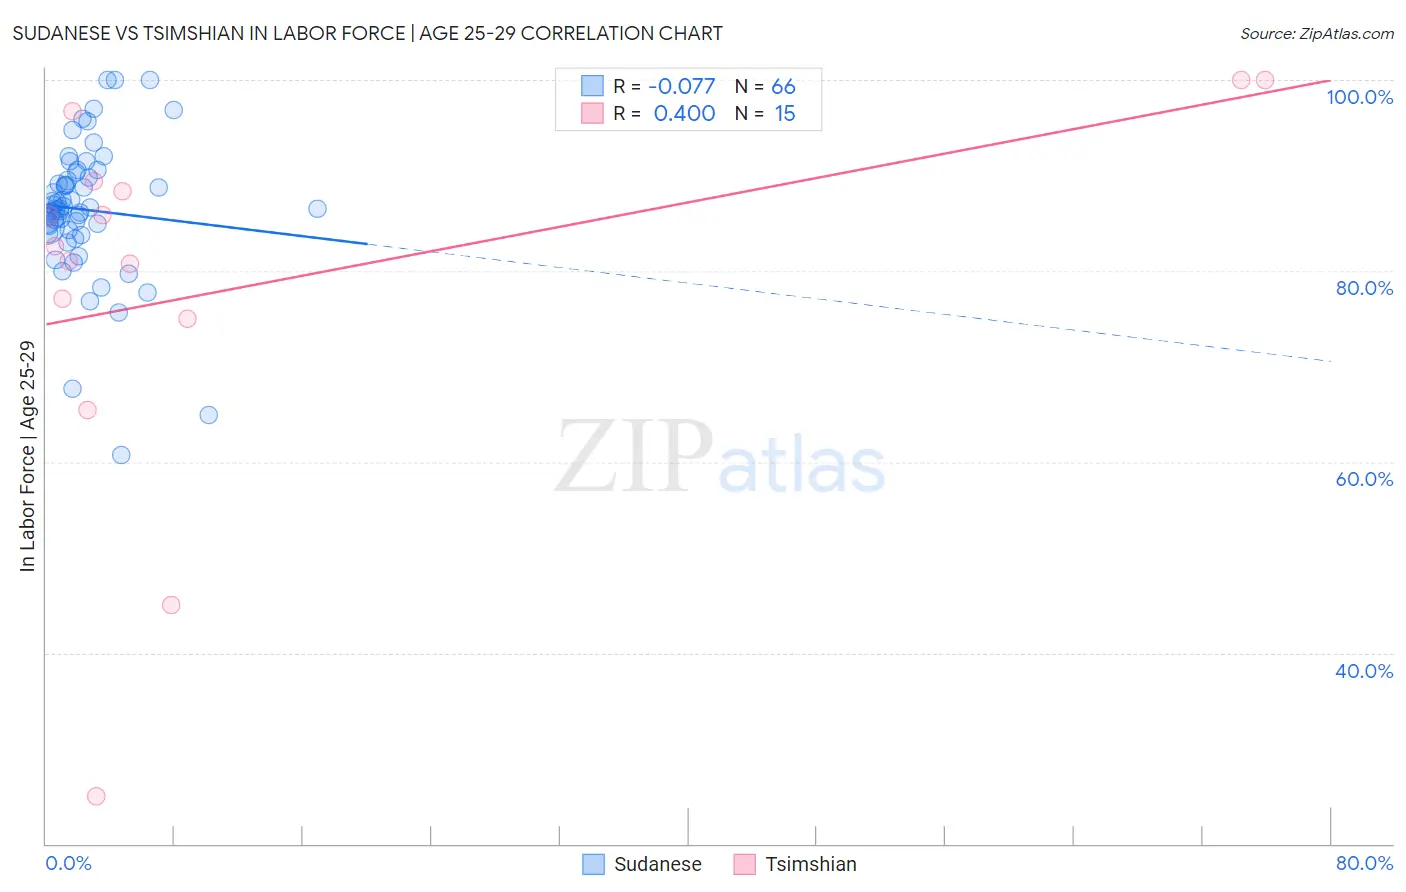
Sudanese vs Tsimshian In Labor Force | Age 25-29 Correlation Chart
The statistical analysis conducted on geographies consisting of 110,131,704 people shows a slight negative correlation between the proportion of Sudanese and labor force participation rate among population between the ages 25 and 29 in the United States with a correlation coefficient (R) of -0.077 and weighted average of 85.9%. Similarly, the statistical analysis conducted on geographies consisting of 15,624,837 people shows a mild positive correlation between the proportion of Tsimshian and labor force participation rate among population between the ages 25 and 29 in the United States with a correlation coefficient (R) of 0.400 and weighted average of 88.7%, a difference of 3.2%.
In Labor Force | Age 25-29 Correlation Summary
| Measurement | Sudanese | Tsimshian |
| Minimum | 60.7% | 25.0% |
| Maximum | 100.0% | 100.0% |
| Range | 39.3% | 75.0% |
| Mean | 86.4% | 78.5% |
| Median | 86.5% | 82.5% |
| Interquartile 25% (IQ1) | 84.3% | 75.0% |
| Interquartile 75% (IQ3) | 89.8% | 89.4% |
| Interquartile Range (IQR) | 5.5% | 14.4% |
| Standard Deviation (Sample) | 7.2% | 20.3% |
| Standard Deviation (Population) | 7.1% | 19.6% |
Similar Demographics by In Labor Force | Age 25-29
Demographics Similar to Sudanese by In Labor Force | Age 25-29
In terms of in labor force | age 25-29, the demographic groups most similar to Sudanese are Immigrants from Eastern Africa (86.0%, a difference of 0.010%), Immigrants from Uganda (86.0%, a difference of 0.020%), Cambodian (86.0%, a difference of 0.040%), Maltese (86.0%, a difference of 0.050%), and Immigrants from Ireland (86.0%, a difference of 0.060%).
| Demographics | Rating | Rank | In Labor Force | Age 25-29 |
| Bulgarians | 100.0 /100 | #18 | Exceptional 86.0% |
| Cape Verdeans | 100.0 /100 | #19 | Exceptional 86.0% |
| Immigrants | Ireland | 100.0 /100 | #20 | Exceptional 86.0% |
| Maltese | 100.0 /100 | #21 | Exceptional 86.0% |
| Cambodians | 100.0 /100 | #22 | Exceptional 86.0% |
| Immigrants | Uganda | 100.0 /100 | #23 | Exceptional 86.0% |
| Immigrants | Eastern Africa | 100.0 /100 | #24 | Exceptional 86.0% |
| Sudanese | 100.0 /100 | #25 | Exceptional 85.9% |
| Immigrants | North Macedonia | 100.0 /100 | #26 | Exceptional 85.9% |
| Paraguayans | 100.0 /100 | #27 | Exceptional 85.9% |
| Ugandans | 100.0 /100 | #28 | Exceptional 85.9% |
| Immigrants | Liberia | 100.0 /100 | #29 | Exceptional 85.9% |
| Immigrants | Serbia | 100.0 /100 | #30 | Exceptional 85.9% |
| German Russians | 100.0 /100 | #31 | Exceptional 85.8% |
| Slovaks | 100.0 /100 | #32 | Exceptional 85.8% |
Demographics Similar to Tsimshian by In Labor Force | Age 25-29
In terms of in labor force | age 25-29, the demographic groups most similar to Tsimshian are Immigrants from Somalia (87.1%, a difference of 1.8%), Somali (87.1%, a difference of 1.8%), Carpatho Rusyn (87.0%, a difference of 1.9%), Luxembourger (86.9%, a difference of 2.0%), and Slovene (86.4%, a difference of 2.7%).
| Demographics | Rating | Rank | In Labor Force | Age 25-29 |
| Tsimshian | 100.0 /100 | #1 | Exceptional 88.7% |
| Immigrants | Somalia | 100.0 /100 | #2 | Exceptional 87.1% |
| Somalis | 100.0 /100 | #3 | Exceptional 87.1% |
| Carpatho Rusyns | 100.0 /100 | #4 | Exceptional 87.0% |
| Luxembourgers | 100.0 /100 | #5 | Exceptional 86.9% |
| Slovenes | 100.0 /100 | #6 | Exceptional 86.4% |
| Immigrants | Bosnia and Herzegovina | 100.0 /100 | #7 | Exceptional 86.3% |
| Immigrants | Cabo Verde | 100.0 /100 | #8 | Exceptional 86.2% |
| Ethiopians | 100.0 /100 | #9 | Exceptional 86.2% |
| Liberians | 100.0 /100 | #10 | Exceptional 86.1% |
| Immigrants | Ethiopia | 100.0 /100 | #11 | Exceptional 86.1% |
| Immigrants | Lithuania | 100.0 /100 | #12 | Exceptional 86.1% |
| Norwegians | 100.0 /100 | #13 | Exceptional 86.1% |
| Latvians | 100.0 /100 | #14 | Exceptional 86.1% |
| Bolivians | 100.0 /100 | #15 | Exceptional 86.1% |