Sri Lankan vs Iranian Female Poverty
COMPARE
Sri Lankan
Iranian
Female Poverty
Female Poverty Comparison
Sri Lankans
Iranians
12.7%
FEMALE POVERTY
90.9/ 100
METRIC RATING
118th/ 347
METRIC RANK
11.7%
FEMALE POVERTY
99.6/ 100
METRIC RATING
27th/ 347
METRIC RANK
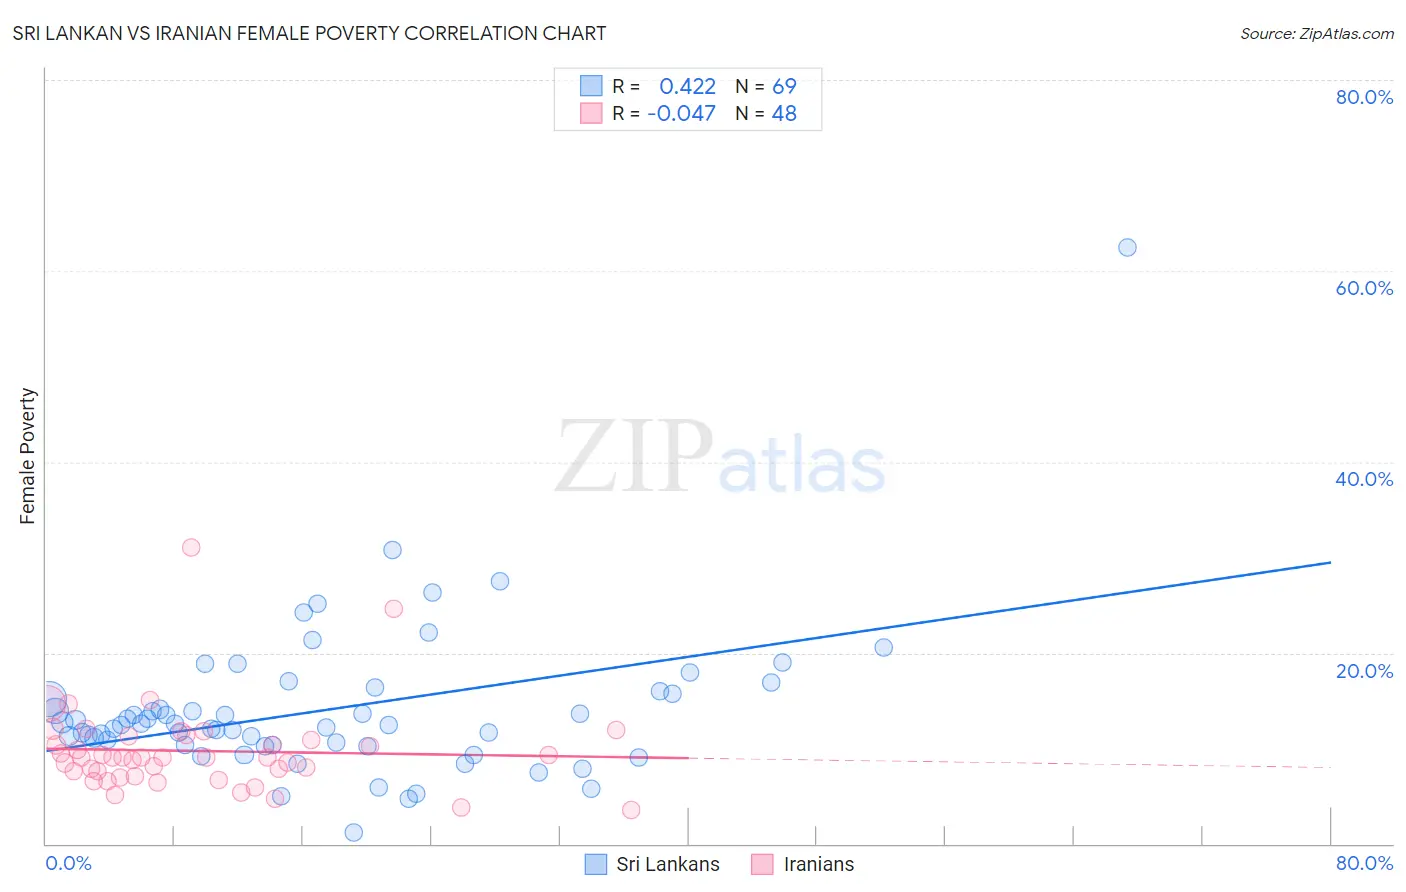
Sri Lankan vs Iranian Female Poverty Correlation Chart
The statistical analysis conducted on geographies consisting of 440,042,655 people shows a moderate positive correlation between the proportion of Sri Lankans and poverty level among females in the United States with a correlation coefficient (R) of 0.422 and weighted average of 12.7%. Similarly, the statistical analysis conducted on geographies consisting of 316,618,692 people shows no correlation between the proportion of Iranians and poverty level among females in the United States with a correlation coefficient (R) of -0.047 and weighted average of 11.7%, a difference of 9.0%.
Female Poverty Correlation Summary
| Measurement | Sri Lankan | Iranian |
| Minimum | 1.2% | 3.6% |
| Maximum | 62.5% | 31.0% |
| Range | 61.3% | 27.5% |
| Mean | 14.0% | 9.7% |
| Median | 12.5% | 9.0% |
| Interquartile 25% (IQ1) | 10.3% | 7.3% |
| Interquartile 75% (IQ3) | 15.8% | 11.0% |
| Interquartile Range (IQR) | 5.5% | 3.7% |
| Standard Deviation (Sample) | 8.1% | 4.7% |
| Standard Deviation (Population) | 8.0% | 4.6% |
Similar Demographics by Female Poverty
Demographics Similar to Sri Lankans by Female Poverty
In terms of female poverty, the demographic groups most similar to Sri Lankans are Albanian (12.7%, a difference of 0.010%), Immigrants from Southern Europe (12.7%, a difference of 0.020%), New Zealander (12.7%, a difference of 0.070%), Immigrants from Russia (12.7%, a difference of 0.090%), and Immigrants from Hungary (12.7%, a difference of 0.17%).
| Demographics | Rating | Rank | Female Poverty |
| Soviet Union | 92.4 /100 | #111 | Exceptional 12.6% |
| Immigrants | Israel | 92.0 /100 | #112 | Exceptional 12.6% |
| Canadians | 92.0 /100 | #113 | Exceptional 12.7% |
| Welsh | 91.6 /100 | #114 | Exceptional 12.7% |
| Puget Sound Salish | 91.5 /100 | #115 | Exceptional 12.7% |
| Immigrants | Russia | 91.2 /100 | #116 | Exceptional 12.7% |
| Immigrants | Southern Europe | 90.9 /100 | #117 | Exceptional 12.7% |
| Sri Lankans | 90.9 /100 | #118 | Exceptional 12.7% |
| Albanians | 90.8 /100 | #119 | Exceptional 12.7% |
| New Zealanders | 90.6 /100 | #120 | Exceptional 12.7% |
| Immigrants | Hungary | 90.3 /100 | #121 | Exceptional 12.7% |
| French Canadians | 90.2 /100 | #122 | Exceptional 12.7% |
| Immigrants | South Eastern Asia | 89.9 /100 | #123 | Excellent 12.7% |
| Immigrants | Norway | 89.3 /100 | #124 | Excellent 12.8% |
| Argentineans | 89.1 /100 | #125 | Excellent 12.8% |
Demographics Similar to Iranians by Female Poverty
In terms of female poverty, the demographic groups most similar to Iranians are Immigrants from Northern Europe (11.6%, a difference of 0.11%), Croatian (11.6%, a difference of 0.11%), Immigrants from Korea (11.7%, a difference of 0.21%), Immigrants from North Macedonia (11.7%, a difference of 0.36%), and Luxembourger (11.6%, a difference of 0.38%).
| Demographics | Rating | Rank | Female Poverty |
| Eastern Europeans | 99.7 /100 | #20 | Exceptional 11.5% |
| Italians | 99.7 /100 | #21 | Exceptional 11.6% |
| Swedes | 99.7 /100 | #22 | Exceptional 11.6% |
| Burmese | 99.7 /100 | #23 | Exceptional 11.6% |
| Luxembourgers | 99.7 /100 | #24 | Exceptional 11.6% |
| Immigrants | Northern Europe | 99.6 /100 | #25 | Exceptional 11.6% |
| Croatians | 99.6 /100 | #26 | Exceptional 11.6% |
| Iranians | 99.6 /100 | #27 | Exceptional 11.7% |
| Immigrants | Korea | 99.6 /100 | #28 | Exceptional 11.7% |
| Immigrants | North Macedonia | 99.6 /100 | #29 | Exceptional 11.7% |
| Greeks | 99.5 /100 | #30 | Exceptional 11.7% |
| Poles | 99.5 /100 | #31 | Exceptional 11.7% |
| Danes | 99.5 /100 | #32 | Exceptional 11.7% |
| Cypriots | 99.5 /100 | #33 | Exceptional 11.8% |
| Immigrants | Singapore | 99.4 /100 | #34 | Exceptional 11.8% |