Sri Lankan vs Iranian Unemployment Among Women with Children Under 18 years
COMPARE
Sri Lankan
Iranian
Unemployment Among Women with Children Under 18 years
Unemployment Among Women with Children Under 18 years Comparison
Sri Lankans
Iranians
5.2%
UNEMPLOYMENT AMONG WOMEN WITH CHILDREN UNDER 18 YEARS
90.3/ 100
METRIC RATING
103rd/ 347
METRIC RANK
5.2%
UNEMPLOYMENT AMONG WOMEN WITH CHILDREN UNDER 18 YEARS
89.7/ 100
METRIC RATING
108th/ 347
METRIC RANK
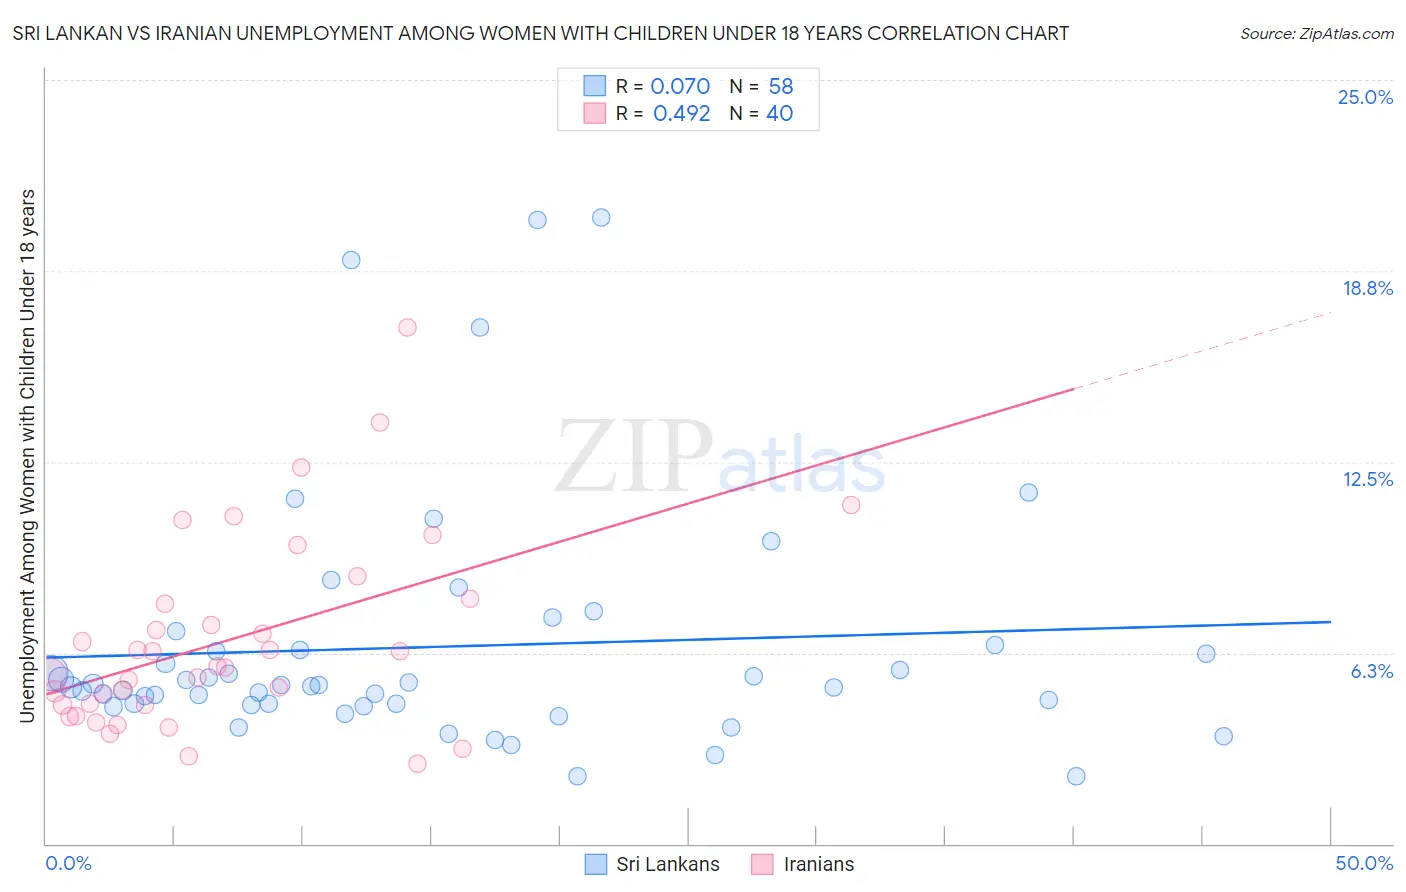
Sri Lankan vs Iranian Unemployment Among Women with Children Under 18 years Correlation Chart
The statistical analysis conducted on geographies consisting of 422,094,249 people shows a slight positive correlation between the proportion of Sri Lankans and unemployment rate among women with children under the age of 18 in the United States with a correlation coefficient (R) of 0.070 and weighted average of 5.2%. Similarly, the statistical analysis conducted on geographies consisting of 307,838,151 people shows a moderate positive correlation between the proportion of Iranians and unemployment rate among women with children under the age of 18 in the United States with a correlation coefficient (R) of 0.492 and weighted average of 5.2%, a difference of 0.13%.
Unemployment Among Women with Children Under 18 years Correlation Summary
| Measurement | Sri Lankan | Iranian |
| Minimum | 2.2% | 2.6% |
| Maximum | 20.5% | 16.9% |
| Range | 18.3% | 14.3% |
| Mean | 6.4% | 6.7% |
| Median | 5.2% | 5.8% |
| Interquartile 25% (IQ1) | 4.6% | 4.5% |
| Interquartile 75% (IQ3) | 6.4% | 7.9% |
| Interquartile Range (IQR) | 1.8% | 3.4% |
| Standard Deviation (Sample) | 4.0% | 3.2% |
| Standard Deviation (Population) | 4.0% | 3.1% |
Demographics Similar to Sri Lankans and Iranians by Unemployment Among Women with Children Under 18 years
In terms of unemployment among women with children under 18 years, the demographic groups most similar to Sri Lankans are Immigrants from Switzerland (5.2%, a difference of 0.040%), Immigrants from France (5.2%, a difference of 0.060%), Pakistani (5.2%, a difference of 0.080%), Slavic (5.2%, a difference of 0.090%), and Immigrants from Netherlands (5.2%, a difference of 0.15%). Similarly, the demographic groups most similar to Iranians are Slavic (5.2%, a difference of 0.040%), Pakistani (5.2%, a difference of 0.050%), Immigrants from France (5.2%, a difference of 0.070%), Immigrants from Switzerland (5.2%, a difference of 0.090%), and Immigrants from Russia (5.2%, a difference of 0.13%).
| Demographics | Rating | Rank | Unemployment Among Women with Children Under 18 years |
| Immigrants | North America | 92.3 /100 | #95 | Exceptional 5.2% |
| Immigrants | Albania | 92.2 /100 | #96 | Exceptional 5.2% |
| Palestinians | 92.2 /100 | #97 | Exceptional 5.2% |
| Immigrants | Vietnam | 92.0 /100 | #98 | Exceptional 5.2% |
| Cubans | 91.8 /100 | #99 | Exceptional 5.2% |
| Immigrants | Greece | 91.4 /100 | #100 | Exceptional 5.2% |
| Immigrants | Netherlands | 91.0 /100 | #101 | Exceptional 5.2% |
| Immigrants | Cuba | 90.9 /100 | #102 | Exceptional 5.2% |
| Sri Lankans | 90.3 /100 | #103 | Exceptional 5.2% |
| Immigrants | Switzerland | 90.1 /100 | #104 | Exceptional 5.2% |
| Immigrants | France | 90.0 /100 | #105 | Excellent 5.2% |
| Pakistanis | 89.9 /100 | #106 | Excellent 5.2% |
| Slavs | 89.8 /100 | #107 | Excellent 5.2% |
| Iranians | 89.7 /100 | #108 | Excellent 5.2% |
| Immigrants | Russia | 89.0 /100 | #109 | Excellent 5.2% |
| Immigrants | Czechoslovakia | 88.9 /100 | #110 | Excellent 5.2% |
| French Canadians | 88.9 /100 | #111 | Excellent 5.2% |
| Immigrants | Eastern Europe | 88.5 /100 | #112 | Excellent 5.2% |
| French | 88.4 /100 | #113 | Excellent 5.2% |
| Kenyans | 88.2 /100 | #114 | Excellent 5.3% |
| Hungarians | 88.1 /100 | #115 | Excellent 5.3% |