Northern European vs Iranian Female Poverty
COMPARE
Northern European
Iranian
Female Poverty
Female Poverty Comparison
Northern Europeans
Iranians
12.4%
FEMALE POVERTY
96.6/ 100
METRIC RATING
84th/ 347
METRIC RANK
11.7%
FEMALE POVERTY
99.6/ 100
METRIC RATING
27th/ 347
METRIC RANK
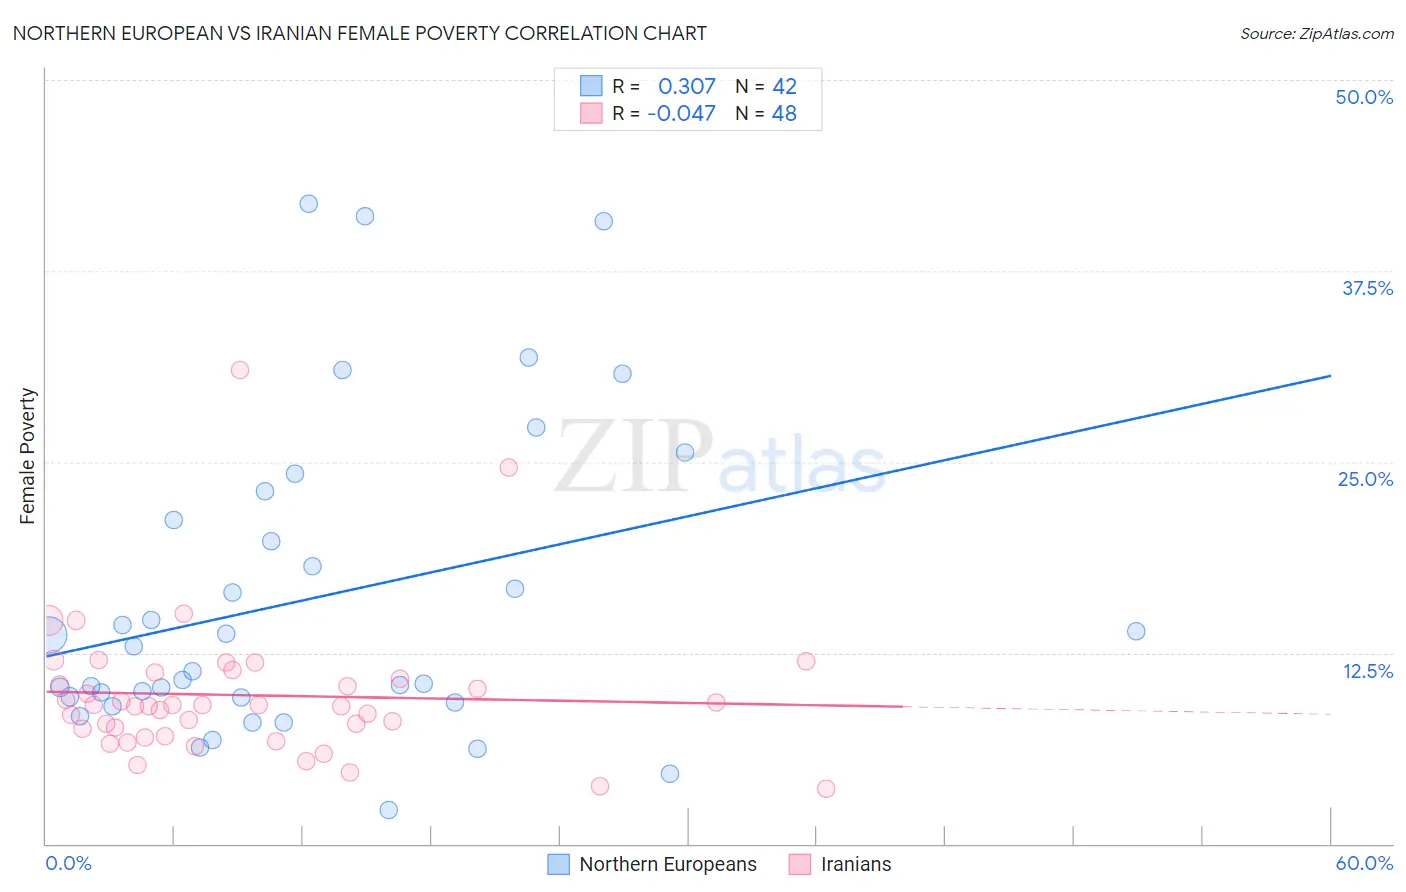
Northern European vs Iranian Female Poverty Correlation Chart
The statistical analysis conducted on geographies consisting of 405,818,739 people shows a mild positive correlation between the proportion of Northern Europeans and poverty level among females in the United States with a correlation coefficient (R) of 0.307 and weighted average of 12.4%. Similarly, the statistical analysis conducted on geographies consisting of 316,618,692 people shows no correlation between the proportion of Iranians and poverty level among females in the United States with a correlation coefficient (R) of -0.047 and weighted average of 11.7%, a difference of 6.1%.
Female Poverty Correlation Summary
| Measurement | Northern European | Iranian |
| Minimum | 2.2% | 3.6% |
| Maximum | 41.9% | 31.0% |
| Range | 39.7% | 27.5% |
| Mean | 16.1% | 9.7% |
| Median | 12.1% | 9.0% |
| Interquartile 25% (IQ1) | 9.5% | 7.3% |
| Interquartile 75% (IQ3) | 21.2% | 11.0% |
| Interquartile Range (IQR) | 11.6% | 3.7% |
| Standard Deviation (Sample) | 10.2% | 4.7% |
| Standard Deviation (Population) | 10.1% | 4.6% |
Similar Demographics by Female Poverty
Demographics Similar to Northern Europeans by Female Poverty
In terms of female poverty, the demographic groups most similar to Northern Europeans are Irish (12.4%, a difference of 0.050%), Dutch (12.4%, a difference of 0.080%), Okinawan (12.4%, a difference of 0.10%), Finnish (12.4%, a difference of 0.15%), and Immigrants from England (12.3%, a difference of 0.23%).
| Demographics | Rating | Rank | Female Poverty |
| Serbians | 97.2 /100 | #77 | Exceptional 12.3% |
| Egyptians | 97.2 /100 | #78 | Exceptional 12.3% |
| Immigrants | North America | 97.1 /100 | #79 | Exceptional 12.3% |
| Slovaks | 97.1 /100 | #80 | Exceptional 12.3% |
| Immigrants | Sweden | 97.1 /100 | #81 | Exceptional 12.3% |
| Jordanians | 97.1 /100 | #82 | Exceptional 12.3% |
| Immigrants | England | 96.9 /100 | #83 | Exceptional 12.3% |
| Northern Europeans | 96.6 /100 | #84 | Exceptional 12.4% |
| Irish | 96.5 /100 | #85 | Exceptional 12.4% |
| Dutch | 96.5 /100 | #86 | Exceptional 12.4% |
| Okinawans | 96.4 /100 | #87 | Exceptional 12.4% |
| Finns | 96.4 /100 | #88 | Exceptional 12.4% |
| English | 96.1 /100 | #89 | Exceptional 12.4% |
| Immigrants | Denmark | 95.8 /100 | #90 | Exceptional 12.4% |
| Belgians | 95.8 /100 | #91 | Exceptional 12.4% |
Demographics Similar to Iranians by Female Poverty
In terms of female poverty, the demographic groups most similar to Iranians are Immigrants from Northern Europe (11.6%, a difference of 0.11%), Croatian (11.6%, a difference of 0.11%), Immigrants from Korea (11.7%, a difference of 0.21%), Immigrants from North Macedonia (11.7%, a difference of 0.36%), and Luxembourger (11.6%, a difference of 0.38%).
| Demographics | Rating | Rank | Female Poverty |
| Eastern Europeans | 99.7 /100 | #20 | Exceptional 11.5% |
| Italians | 99.7 /100 | #21 | Exceptional 11.6% |
| Swedes | 99.7 /100 | #22 | Exceptional 11.6% |
| Burmese | 99.7 /100 | #23 | Exceptional 11.6% |
| Luxembourgers | 99.7 /100 | #24 | Exceptional 11.6% |
| Immigrants | Northern Europe | 99.6 /100 | #25 | Exceptional 11.6% |
| Croatians | 99.6 /100 | #26 | Exceptional 11.6% |
| Iranians | 99.6 /100 | #27 | Exceptional 11.7% |
| Immigrants | Korea | 99.6 /100 | #28 | Exceptional 11.7% |
| Immigrants | North Macedonia | 99.6 /100 | #29 | Exceptional 11.7% |
| Greeks | 99.5 /100 | #30 | Exceptional 11.7% |
| Poles | 99.5 /100 | #31 | Exceptional 11.7% |
| Danes | 99.5 /100 | #32 | Exceptional 11.7% |
| Cypriots | 99.5 /100 | #33 | Exceptional 11.8% |
| Immigrants | Singapore | 99.4 /100 | #34 | Exceptional 11.8% |