Spanish American Indian vs Immigrants from St. Vincent and the Grenadines Child Poverty Among Girls Under 16
COMPARE
Spanish American Indian
Immigrants from St. Vincent and the Grenadines
Child Poverty Among Girls Under 16
Child Poverty Among Girls Under 16 Comparison
Spanish American Indians
Immigrants from St. Vincent and the Grenadines
19.9%
CHILD POVERTY AMONG GIRLS UNDER 16
0.1/ 100
METRIC RATING
268th/ 347
METRIC RANK
20.1%
CHILD POVERTY AMONG GIRLS UNDER 16
0.0/ 100
METRIC RATING
274th/ 347
METRIC RANK
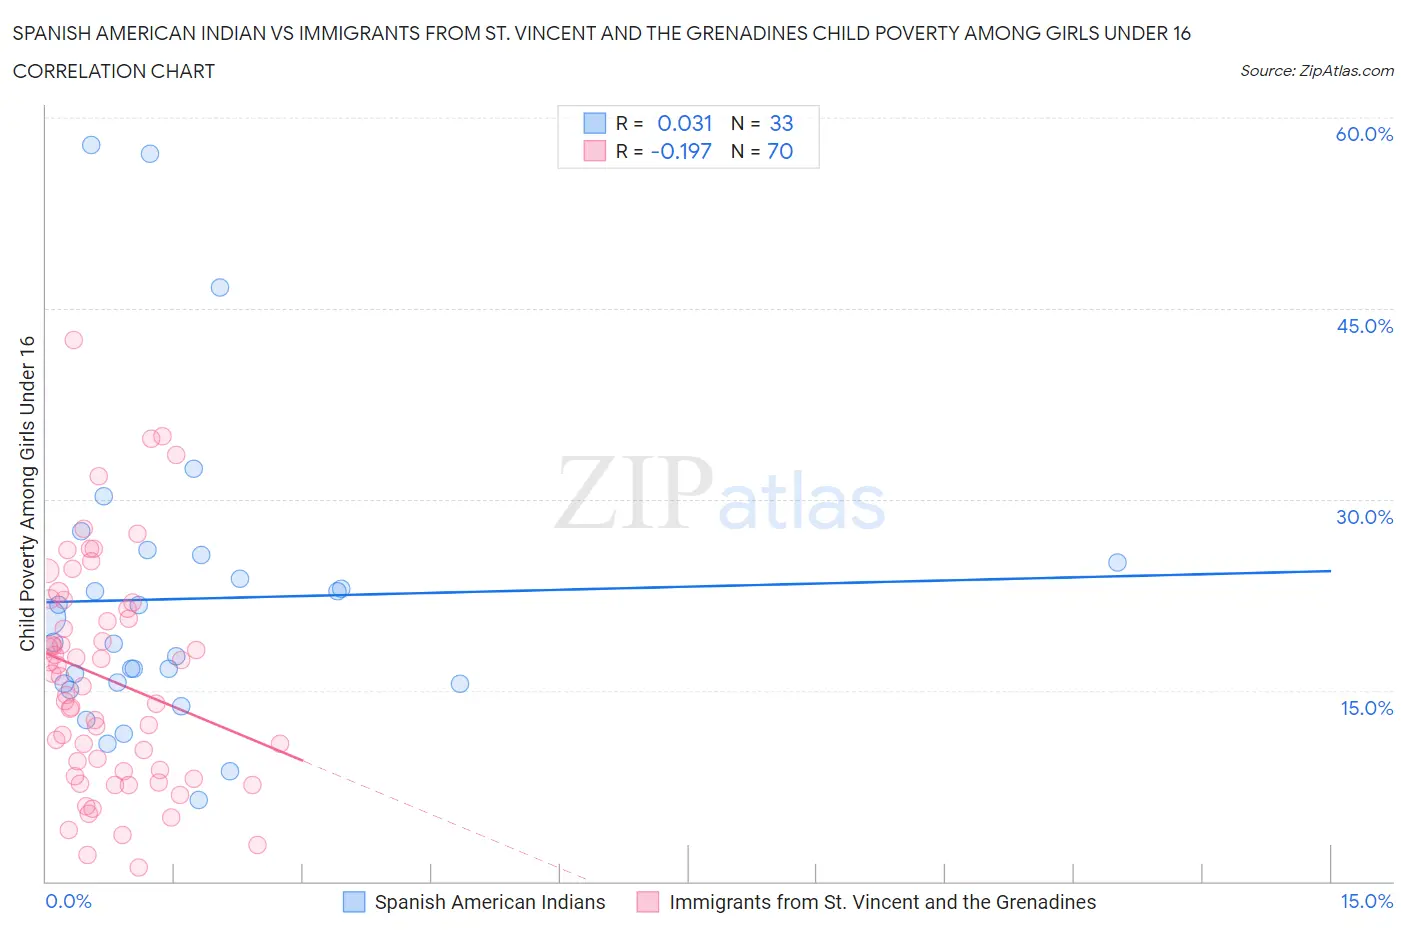
Spanish American Indian vs Immigrants from St. Vincent and the Grenadines Child Poverty Among Girls Under 16 Correlation Chart
The statistical analysis conducted on geographies consisting of 72,992,816 people shows no correlation between the proportion of Spanish American Indians and poverty level among girls under the age of 16 in the United States with a correlation coefficient (R) of 0.031 and weighted average of 19.9%. Similarly, the statistical analysis conducted on geographies consisting of 56,098,700 people shows a poor negative correlation between the proportion of Immigrants from St. Vincent and the Grenadines and poverty level among girls under the age of 16 in the United States with a correlation coefficient (R) of -0.197 and weighted average of 20.1%, a difference of 1.1%.
Child Poverty Among Girls Under 16 Correlation Summary
| Measurement | Spanish American Indian | Immigrants from St. Vincent and the Grenadines |
| Minimum | 6.4% | 1.1% |
| Maximum | 57.8% | 42.5% |
| Range | 51.4% | 41.4% |
| Mean | 22.2% | 15.9% |
| Median | 18.8% | 15.7% |
| Interquartile 25% (IQ1) | 15.5% | 8.6% |
| Interquartile 75% (IQ3) | 25.3% | 21.4% |
| Interquartile Range (IQR) | 9.8% | 12.7% |
| Standard Deviation (Sample) | 11.9% | 8.8% |
| Standard Deviation (Population) | 11.7% | 8.7% |
Demographics Similar to Spanish American Indians and Immigrants from St. Vincent and the Grenadines by Child Poverty Among Girls Under 16
In terms of child poverty among girls under 16, the demographic groups most similar to Spanish American Indians are Immigrants from Bangladesh (19.9%, a difference of 0.040%), Liberian (19.9%, a difference of 0.10%), Spanish American (19.8%, a difference of 0.26%), Cherokee (19.9%, a difference of 0.28%), and Immigrants from Barbados (19.9%, a difference of 0.38%). Similarly, the demographic groups most similar to Immigrants from St. Vincent and the Grenadines are Subsaharan African (20.1%, a difference of 0.14%), Bangladeshi (20.0%, a difference of 0.42%), Comanche (20.2%, a difference of 0.46%), Belizean (20.2%, a difference of 0.57%), and Barbadian (20.2%, a difference of 0.60%).
| Demographics | Rating | Rank | Child Poverty Among Girls Under 16 |
| Vietnamese | 0.2 /100 | #261 | Tragic 19.5% |
| Chickasaw | 0.1 /100 | #262 | Tragic 19.6% |
| Immigrants | Burma/Myanmar | 0.1 /100 | #263 | Tragic 19.7% |
| Jamaicans | 0.1 /100 | #264 | Tragic 19.7% |
| Immigrants | Jamaica | 0.1 /100 | #265 | Tragic 19.8% |
| Spanish Americans | 0.1 /100 | #266 | Tragic 19.8% |
| Immigrants | Bangladesh | 0.1 /100 | #267 | Tragic 19.9% |
| Spanish American Indians | 0.1 /100 | #268 | Tragic 19.9% |
| Liberians | 0.1 /100 | #269 | Tragic 19.9% |
| Cherokee | 0.1 /100 | #270 | Tragic 19.9% |
| Immigrants | Barbados | 0.1 /100 | #271 | Tragic 19.9% |
| Immigrants | El Salvador | 0.1 /100 | #272 | Tragic 20.0% |
| Bangladeshis | 0.1 /100 | #273 | Tragic 20.0% |
| Immigrants | St. Vincent and the Grenadines | 0.0 /100 | #274 | Tragic 20.1% |
| Sub-Saharan Africans | 0.0 /100 | #275 | Tragic 20.1% |
| Comanche | 0.0 /100 | #276 | Tragic 20.2% |
| Belizeans | 0.0 /100 | #277 | Tragic 20.2% |
| Barbadians | 0.0 /100 | #278 | Tragic 20.2% |
| Immigrants | Zaire | 0.0 /100 | #279 | Tragic 20.2% |
| Immigrants | Liberia | 0.0 /100 | #280 | Tragic 20.2% |
| Central Americans | 0.0 /100 | #281 | Tragic 20.2% |