Spanish American Indian vs German Russian Child Poverty Among Girls Under 16
COMPARE
Spanish American Indian
German Russian
Child Poverty Among Girls Under 16
Child Poverty Among Girls Under 16 Comparison
Spanish American Indians
German Russians
19.9%
CHILD POVERTY AMONG GIRLS UNDER 16
0.1/ 100
METRIC RATING
268th/ 347
METRIC RANK
17.8%
CHILD POVERTY AMONG GIRLS UNDER 16
5.7/ 100
METRIC RATING
215th/ 347
METRIC RANK
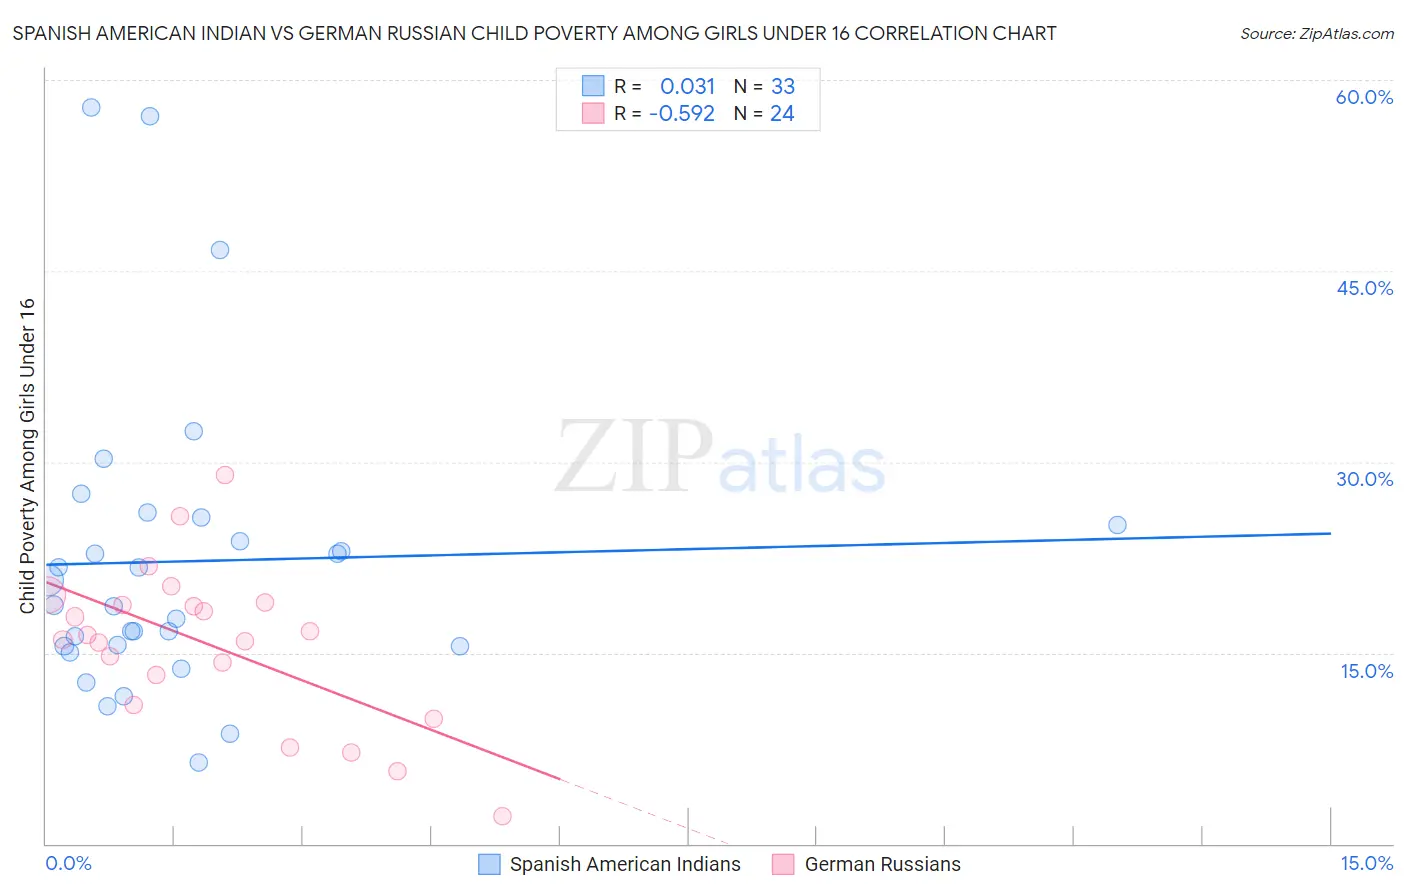
Spanish American Indian vs German Russian Child Poverty Among Girls Under 16 Correlation Chart
The statistical analysis conducted on geographies consisting of 72,992,816 people shows no correlation between the proportion of Spanish American Indians and poverty level among girls under the age of 16 in the United States with a correlation coefficient (R) of 0.031 and weighted average of 19.9%. Similarly, the statistical analysis conducted on geographies consisting of 96,035,959 people shows a substantial negative correlation between the proportion of German Russians and poverty level among girls under the age of 16 in the United States with a correlation coefficient (R) of -0.592 and weighted average of 17.8%, a difference of 11.6%.
Child Poverty Among Girls Under 16 Correlation Summary
| Measurement | Spanish American Indian | German Russian |
| Minimum | 6.4% | 2.2% |
| Maximum | 57.8% | 28.9% |
| Range | 51.4% | 26.8% |
| Mean | 22.2% | 15.6% |
| Median | 18.8% | 16.2% |
| Interquartile 25% (IQ1) | 15.5% | 12.1% |
| Interquartile 75% (IQ3) | 25.3% | 18.9% |
| Interquartile Range (IQR) | 9.8% | 6.8% |
| Standard Deviation (Sample) | 11.9% | 6.2% |
| Standard Deviation (Population) | 11.7% | 6.0% |
Similar Demographics by Child Poverty Among Girls Under 16
Demographics Similar to Spanish American Indians by Child Poverty Among Girls Under 16
In terms of child poverty among girls under 16, the demographic groups most similar to Spanish American Indians are Immigrants from Bangladesh (19.9%, a difference of 0.040%), Liberian (19.9%, a difference of 0.10%), Spanish American (19.8%, a difference of 0.26%), Cherokee (19.9%, a difference of 0.28%), and Immigrants from Barbados (19.9%, a difference of 0.38%).
| Demographics | Rating | Rank | Child Poverty Among Girls Under 16 |
| Vietnamese | 0.2 /100 | #261 | Tragic 19.5% |
| Chickasaw | 0.1 /100 | #262 | Tragic 19.6% |
| Immigrants | Burma/Myanmar | 0.1 /100 | #263 | Tragic 19.7% |
| Jamaicans | 0.1 /100 | #264 | Tragic 19.7% |
| Immigrants | Jamaica | 0.1 /100 | #265 | Tragic 19.8% |
| Spanish Americans | 0.1 /100 | #266 | Tragic 19.8% |
| Immigrants | Bangladesh | 0.1 /100 | #267 | Tragic 19.9% |
| Spanish American Indians | 0.1 /100 | #268 | Tragic 19.9% |
| Liberians | 0.1 /100 | #269 | Tragic 19.9% |
| Cherokee | 0.1 /100 | #270 | Tragic 19.9% |
| Immigrants | Barbados | 0.1 /100 | #271 | Tragic 19.9% |
| Immigrants | El Salvador | 0.1 /100 | #272 | Tragic 20.0% |
| Bangladeshis | 0.1 /100 | #273 | Tragic 20.0% |
| Immigrants | St. Vincent and the Grenadines | 0.0 /100 | #274 | Tragic 20.1% |
| Sub-Saharan Africans | 0.0 /100 | #275 | Tragic 20.1% |
Demographics Similar to German Russians by Child Poverty Among Girls Under 16
In terms of child poverty among girls under 16, the demographic groups most similar to German Russians are Malaysian (17.8%, a difference of 0.0%), Pennsylvania German (17.8%, a difference of 0.020%), Moroccan (17.8%, a difference of 0.10%), Japanese (17.8%, a difference of 0.19%), and Immigrants from Thailand (17.7%, a difference of 0.28%).
| Demographics | Rating | Rank | Child Poverty Among Girls Under 16 |
| Sierra Leoneans | 8.9 /100 | #208 | Tragic 17.6% |
| Panamanians | 8.7 /100 | #209 | Tragic 17.6% |
| Immigrants | Immigrants | 7.3 /100 | #210 | Tragic 17.7% |
| Immigrants | Eastern Africa | 6.4 /100 | #211 | Tragic 17.7% |
| Immigrants | Thailand | 6.3 /100 | #212 | Tragic 17.7% |
| Pennsylvania Germans | 5.7 /100 | #213 | Tragic 17.8% |
| Malaysians | 5.7 /100 | #214 | Tragic 17.8% |
| German Russians | 5.7 /100 | #215 | Tragic 17.8% |
| Moroccans | 5.5 /100 | #216 | Tragic 17.8% |
| Japanese | 5.3 /100 | #217 | Tragic 17.8% |
| Alaska Natives | 5.2 /100 | #218 | Tragic 17.8% |
| Immigrants | Panama | 4.7 /100 | #219 | Tragic 17.9% |
| Cubans | 4.1 /100 | #220 | Tragic 18.0% |
| Immigrants | Micronesia | 3.5 /100 | #221 | Tragic 18.0% |
| Immigrants | Cambodia | 2.9 /100 | #222 | Tragic 18.1% |