Scottish vs Immigrants from Dominica Single Male Poverty
COMPARE
Scottish
Immigrants from Dominica
Single Male Poverty
Single Male Poverty Comparison
Scottish
Immigrants from Dominica
14.0%
SINGLE MALE POVERTY
0.1/ 100
METRIC RATING
269th/ 347
METRIC RANK
14.5%
SINGLE MALE POVERTY
0.0/ 100
METRIC RATING
289th/ 347
METRIC RANK
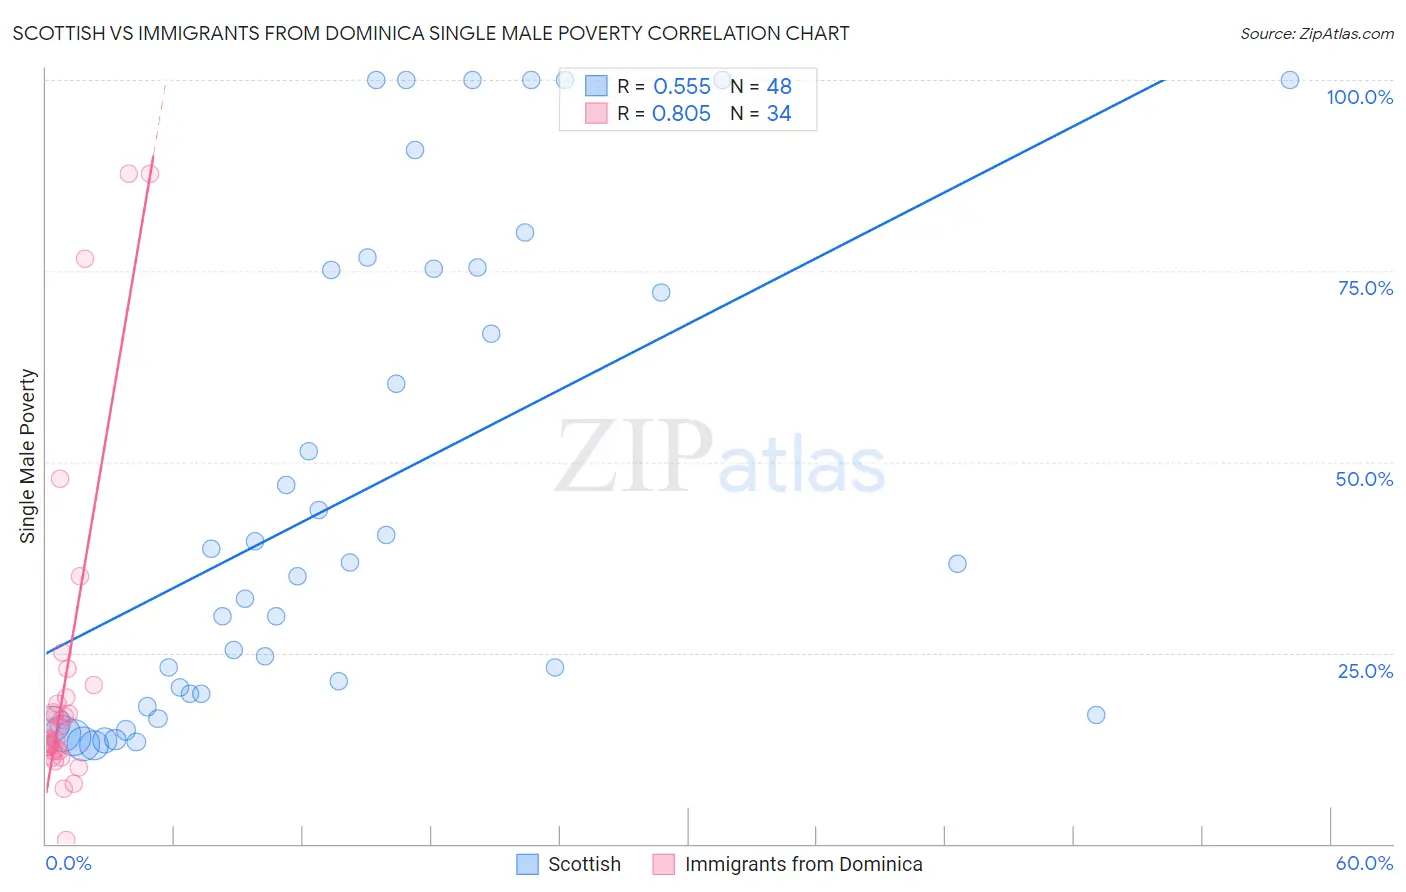
Scottish vs Immigrants from Dominica Single Male Poverty Correlation Chart
The statistical analysis conducted on geographies consisting of 467,829,193 people shows a substantial positive correlation between the proportion of Scottish and poverty level among single males in the United States with a correlation coefficient (R) of 0.555 and weighted average of 14.0%. Similarly, the statistical analysis conducted on geographies consisting of 81,406,108 people shows a very strong positive correlation between the proportion of Immigrants from Dominica and poverty level among single males in the United States with a correlation coefficient (R) of 0.805 and weighted average of 14.5%, a difference of 3.8%.
Single Male Poverty Correlation Summary
| Measurement | Scottish | Immigrants from Dominica |
| Minimum | 12.9% | 0.56% |
| Maximum | 100.0% | 87.7% |
| Range | 87.1% | 87.1% |
| Mean | 45.6% | 21.9% |
| Median | 35.9% | 14.4% |
| Interquartile 25% (IQ1) | 18.8% | 12.1% |
| Interquartile 75% (IQ3) | 75.2% | 19.1% |
| Interquartile Range (IQR) | 56.4% | 7.0% |
| Standard Deviation (Sample) | 31.3% | 21.3% |
| Standard Deviation (Population) | 30.9% | 20.9% |
Demographics Similar to Scottish and Immigrants from Dominica by Single Male Poverty
In terms of single male poverty, the demographic groups most similar to Scottish are Immigrants from Saudi Arabia (14.0%, a difference of 0.010%), Irish (14.0%, a difference of 0.040%), Mexican (14.0%, a difference of 0.10%), Welsh (14.0%, a difference of 0.46%), and Honduran (14.0%, a difference of 0.59%). Similarly, the demographic groups most similar to Immigrants from Dominica are Iroquois (14.5%, a difference of 0.090%), White/Caucasian (14.5%, a difference of 0.090%), Celtic (14.5%, a difference of 0.22%), French (14.4%, a difference of 0.54%), and Immigrants from Bahamas (14.4%, a difference of 0.67%).
| Demographics | Rating | Rank | Single Male Poverty |
| Scottish | 0.1 /100 | #269 | Tragic 14.0% |
| Immigrants | Saudi Arabia | 0.1 /100 | #270 | Tragic 14.0% |
| Irish | 0.1 /100 | #271 | Tragic 14.0% |
| Mexicans | 0.1 /100 | #272 | Tragic 14.0% |
| Welsh | 0.1 /100 | #273 | Tragic 14.0% |
| Hondurans | 0.1 /100 | #274 | Tragic 14.0% |
| English | 0.1 /100 | #275 | Tragic 14.1% |
| Dutch | 0.1 /100 | #276 | Tragic 14.1% |
| Immigrants | Honduras | 0.0 /100 | #277 | Tragic 14.1% |
| Slovaks | 0.0 /100 | #278 | Tragic 14.1% |
| Indonesians | 0.0 /100 | #279 | Tragic 14.1% |
| Hmong | 0.0 /100 | #280 | Tragic 14.2% |
| Hispanics or Latinos | 0.0 /100 | #281 | Tragic 14.2% |
| Spanish Americans | 0.0 /100 | #282 | Tragic 14.2% |
| Yaqui | 0.0 /100 | #283 | Tragic 14.2% |
| Immigrants | Bahamas | 0.0 /100 | #284 | Tragic 14.4% |
| French | 0.0 /100 | #285 | Tragic 14.4% |
| Celtics | 0.0 /100 | #286 | Tragic 14.5% |
| Iroquois | 0.0 /100 | #287 | Tragic 14.5% |
| Whites/Caucasians | 0.0 /100 | #288 | Tragic 14.5% |
| Immigrants | Dominica | 0.0 /100 | #289 | Tragic 14.5% |