Immigrants from Israel vs Dutch West Indian Child Poverty Under the Age of 5
COMPARE
Immigrants from Israel
Dutch West Indian
Child Poverty Under the Age of 5
Child Poverty Under the Age of 5 Comparison
Immigrants from Israel
Dutch West Indians
14.9%
CHILD POVERTY UNDER THE AGE OF 5
99.4/ 100
METRIC RATING
54th/ 347
METRIC RANK
23.3%
CHILD POVERTY UNDER THE AGE OF 5
0.0/ 100
METRIC RATING
318th/ 347
METRIC RANK
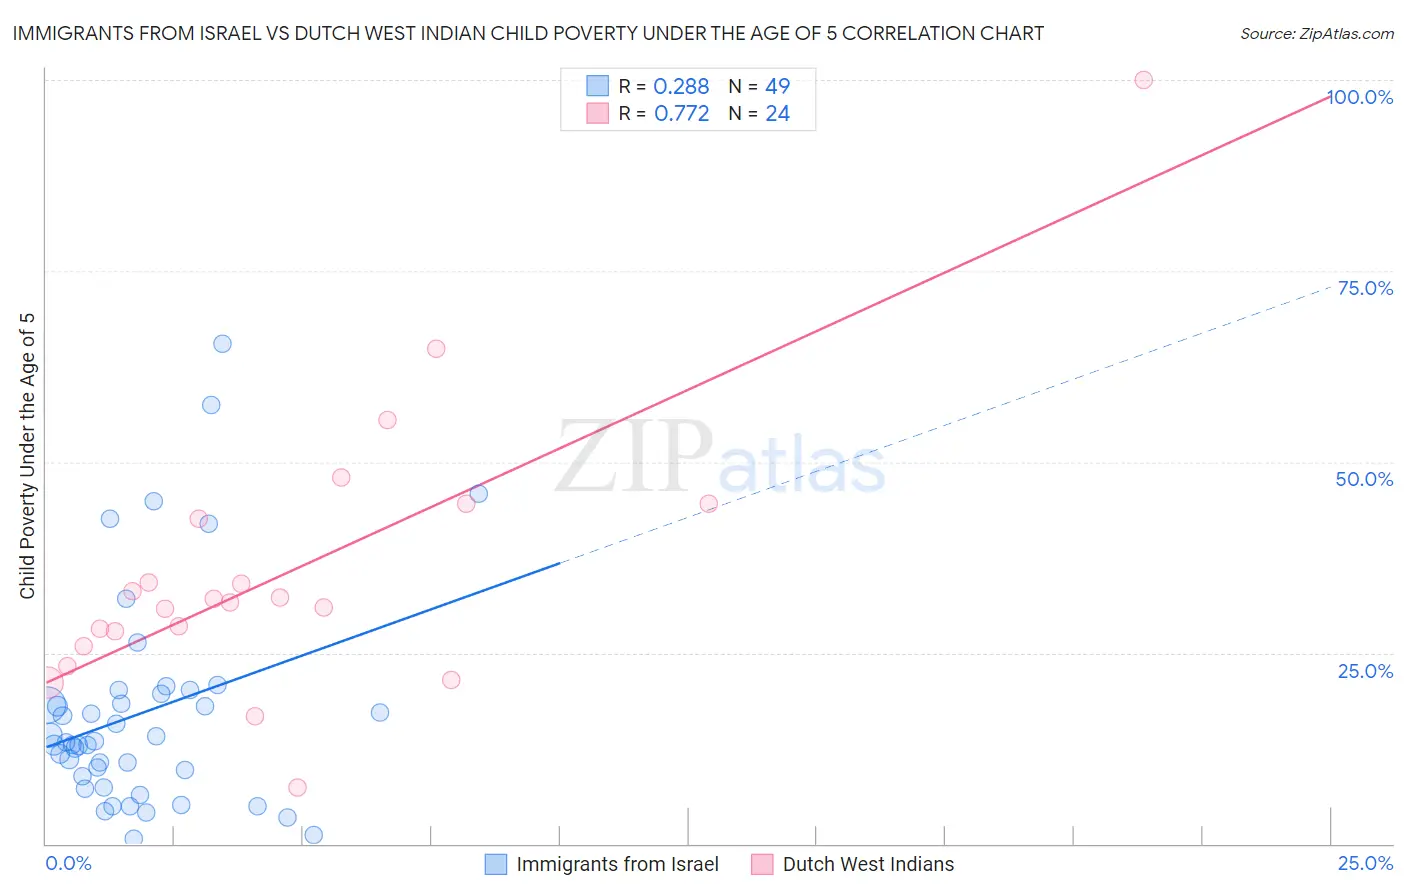
Immigrants from Israel vs Dutch West Indian Child Poverty Under the Age of 5 Correlation Chart
The statistical analysis conducted on geographies consisting of 202,374,512 people shows a weak positive correlation between the proportion of Immigrants from Israel and poverty level among children under the age of 5 in the United States with a correlation coefficient (R) of 0.288 and weighted average of 14.9%. Similarly, the statistical analysis conducted on geographies consisting of 85,247,098 people shows a strong positive correlation between the proportion of Dutch West Indians and poverty level among children under the age of 5 in the United States with a correlation coefficient (R) of 0.772 and weighted average of 23.3%, a difference of 56.1%.
Child Poverty Under the Age of 5 Correlation Summary
| Measurement | Immigrants from Israel | Dutch West Indian |
| Minimum | 0.72% | 7.4% |
| Maximum | 65.4% | 100.0% |
| Range | 64.7% | 92.6% |
| Mean | 17.2% | 35.8% |
| Median | 13.3% | 31.8% |
| Interquartile 25% (IQ1) | 8.1% | 26.9% |
| Interquartile 75% (IQ3) | 19.9% | 43.5% |
| Interquartile Range (IQR) | 11.7% | 16.6% |
| Standard Deviation (Sample) | 14.1% | 18.5% |
| Standard Deviation (Population) | 14.0% | 18.1% |
Similar Demographics by Child Poverty Under the Age of 5
Demographics Similar to Immigrants from Israel by Child Poverty Under the Age of 5
In terms of child poverty under the age of 5, the demographic groups most similar to Immigrants from Israel are Luxembourger (14.9%, a difference of 0.0%), Danish (14.9%, a difference of 0.060%), Immigrants from Pakistan (14.9%, a difference of 0.13%), Immigrants from Serbia (14.9%, a difference of 0.17%), and Egyptian (14.9%, a difference of 0.21%).
| Demographics | Rating | Rank | Child Poverty Under the Age of 5 |
| Russians | 99.6 /100 | #47 | Exceptional 14.8% |
| Immigrants | Czechoslovakia | 99.6 /100 | #48 | Exceptional 14.8% |
| Immigrants | Bulgaria | 99.6 /100 | #49 | Exceptional 14.8% |
| Immigrants | Northern Europe | 99.6 /100 | #50 | Exceptional 14.8% |
| Estonians | 99.6 /100 | #51 | Exceptional 14.8% |
| Immigrants | Serbia | 99.5 /100 | #52 | Exceptional 14.9% |
| Luxembourgers | 99.4 /100 | #53 | Exceptional 14.9% |
| Immigrants | Israel | 99.4 /100 | #54 | Exceptional 14.9% |
| Danes | 99.4 /100 | #55 | Exceptional 14.9% |
| Immigrants | Pakistan | 99.4 /100 | #56 | Exceptional 14.9% |
| Egyptians | 99.4 /100 | #57 | Exceptional 14.9% |
| Swedes | 99.4 /100 | #58 | Exceptional 15.0% |
| Paraguayans | 99.4 /100 | #59 | Exceptional 15.0% |
| Immigrants | Russia | 99.3 /100 | #60 | Exceptional 15.0% |
| Immigrants | Poland | 99.1 /100 | #61 | Exceptional 15.1% |
Demographics Similar to Dutch West Indians by Child Poverty Under the Age of 5
In terms of child poverty under the age of 5, the demographic groups most similar to Dutch West Indians are Menominee (23.3%, a difference of 0.10%), Chippewa (23.4%, a difference of 0.48%), Yakama (23.1%, a difference of 0.60%), Arapaho (23.1%, a difference of 0.72%), and Choctaw (23.5%, a difference of 0.86%).
| Demographics | Rating | Rank | Child Poverty Under the Age of 5 |
| Seminole | 0.0 /100 | #311 | Tragic 22.8% |
| Hondurans | 0.0 /100 | #312 | Tragic 23.0% |
| Bahamians | 0.0 /100 | #313 | Tragic 23.0% |
| U.S. Virgin Islanders | 0.0 /100 | #314 | Tragic 23.0% |
| Arapaho | 0.0 /100 | #315 | Tragic 23.1% |
| Yakama | 0.0 /100 | #316 | Tragic 23.1% |
| Menominee | 0.0 /100 | #317 | Tragic 23.3% |
| Dutch West Indians | 0.0 /100 | #318 | Tragic 23.3% |
| Chippewa | 0.0 /100 | #319 | Tragic 23.4% |
| Choctaw | 0.0 /100 | #320 | Tragic 23.5% |
| Immigrants | Honduras | 0.0 /100 | #321 | Tragic 23.5% |
| Ute | 0.0 /100 | #322 | Tragic 23.5% |
| Pueblo | 0.0 /100 | #323 | Tragic 23.7% |
| Paiute | 0.0 /100 | #324 | Tragic 23.8% |
| Immigrants | Congo | 0.0 /100 | #325 | Tragic 23.9% |