Soviet Union vs Tlingit-Haida Seniors Poverty Over the Age of 65
COMPARE
Soviet Union
Tlingit-Haida
Seniors Poverty Over the Age of 65
Seniors Poverty Over the Age of 65 Comparison
Soviet Union
Tlingit-Haida
12.6%
SENIORS POVERTY OVER THE AGE OF 65
0.1/ 100
METRIC RATING
263rd/ 347
METRIC RANK
8.3%
SENIORS POVERTY OVER THE AGE OF 65
100.0/ 100
METRIC RATING
2nd/ 347
METRIC RANK
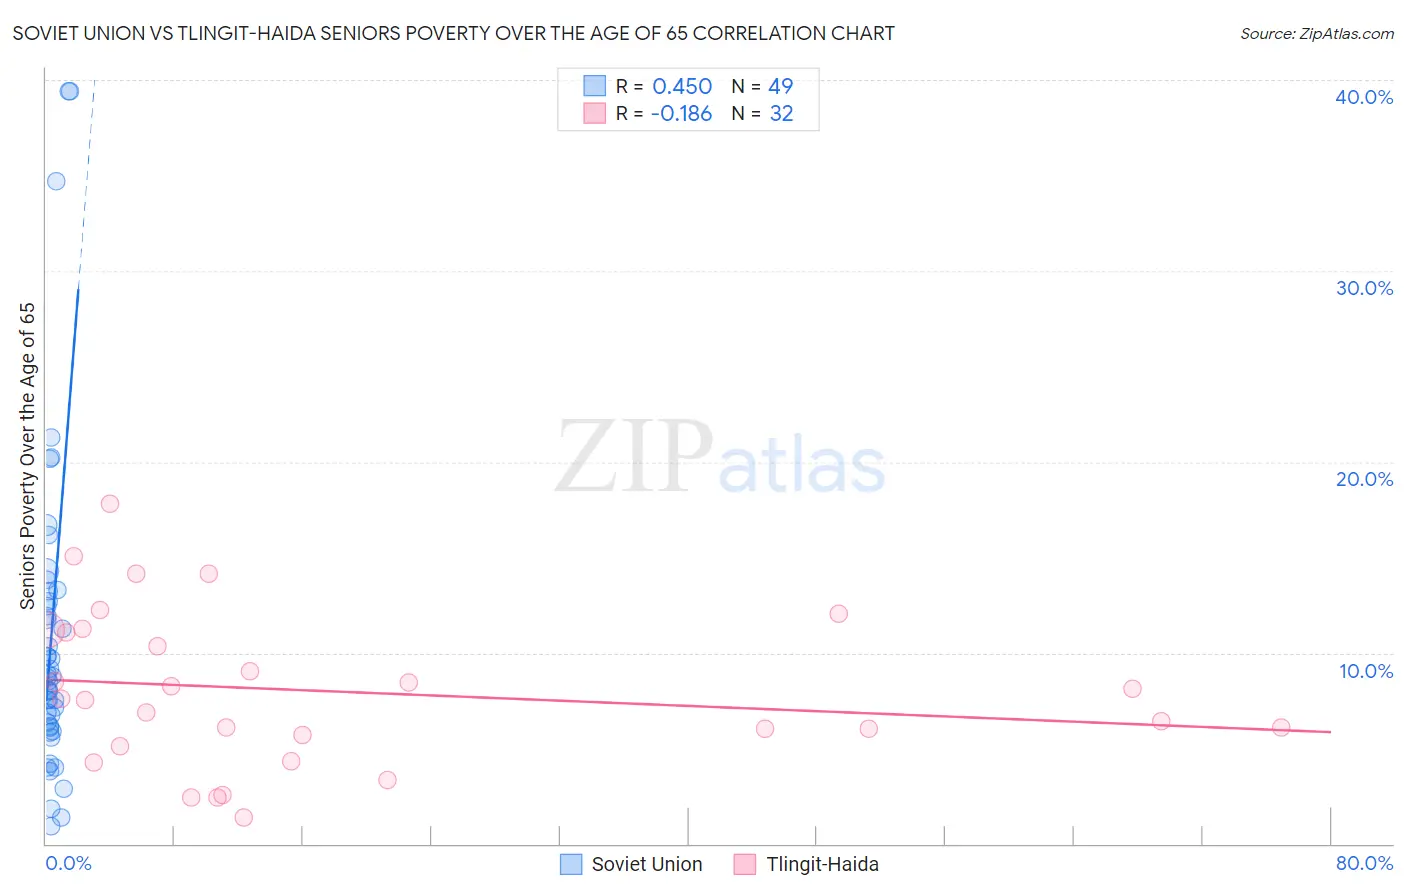
Soviet Union vs Tlingit-Haida Seniors Poverty Over the Age of 65 Correlation Chart
The statistical analysis conducted on geographies consisting of 43,451,489 people shows a moderate positive correlation between the proportion of Soviet Union and poverty level among seniors over the age of 65 in the United States with a correlation coefficient (R) of 0.450 and weighted average of 12.6%. Similarly, the statistical analysis conducted on geographies consisting of 60,762,722 people shows a poor negative correlation between the proportion of Tlingit-Haida and poverty level among seniors over the age of 65 in the United States with a correlation coefficient (R) of -0.186 and weighted average of 8.3%, a difference of 50.3%.
Seniors Poverty Over the Age of 65 Correlation Summary
| Measurement | Soviet Union | Tlingit-Haida |
| Minimum | 0.90% | 1.4% |
| Maximum | 39.4% | 17.8% |
| Range | 38.5% | 16.4% |
| Mean | 10.9% | 8.0% |
| Median | 8.7% | 7.5% |
| Interquartile 25% (IQ1) | 6.1% | 5.4% |
| Interquartile 75% (IQ3) | 12.9% | 11.1% |
| Interquartile Range (IQR) | 6.8% | 5.7% |
| Standard Deviation (Sample) | 8.4% | 4.1% |
| Standard Deviation (Population) | 8.3% | 4.0% |
Similar Demographics by Seniors Poverty Over the Age of 65
Demographics Similar to Soviet Union by Seniors Poverty Over the Age of 65
In terms of seniors poverty over the age of 65, the demographic groups most similar to Soviet Union are Inupiat (12.6%, a difference of 0.070%), Immigrants from Western Africa (12.6%, a difference of 0.16%), Venezuelan (12.5%, a difference of 0.17%), African (12.6%, a difference of 0.33%), and Colombian (12.5%, a difference of 0.37%).
| Demographics | Rating | Rank | Seniors Poverty Over the Age of 65 |
| Immigrants | Panama | 0.2 /100 | #256 | Tragic 12.4% |
| Immigrants | Immigrants | 0.2 /100 | #257 | Tragic 12.4% |
| Dutch West Indians | 0.2 /100 | #258 | Tragic 12.4% |
| Ghanaians | 0.2 /100 | #259 | Tragic 12.4% |
| South Americans | 0.2 /100 | #260 | Tragic 12.5% |
| Colombians | 0.2 /100 | #261 | Tragic 12.5% |
| Venezuelans | 0.1 /100 | #262 | Tragic 12.5% |
| Soviet Union | 0.1 /100 | #263 | Tragic 12.6% |
| Inupiat | 0.1 /100 | #264 | Tragic 12.6% |
| Immigrants | Western Africa | 0.1 /100 | #265 | Tragic 12.6% |
| Africans | 0.1 /100 | #266 | Tragic 12.6% |
| Blackfeet | 0.1 /100 | #267 | Tragic 12.6% |
| Immigrants | Somalia | 0.1 /100 | #268 | Tragic 12.6% |
| Immigrants | Venezuela | 0.1 /100 | #269 | Tragic 12.7% |
| Immigrants | South America | 0.1 /100 | #270 | Tragic 12.7% |
Demographics Similar to Tlingit-Haida by Seniors Poverty Over the Age of 65
In terms of seniors poverty over the age of 65, the demographic groups most similar to Tlingit-Haida are Chinese (8.3%, a difference of 0.15%), Norwegian (8.7%, a difference of 4.0%), Swedish (8.7%, a difference of 4.7%), Immigrants from India (8.8%, a difference of 5.0%), and Danish (8.8%, a difference of 5.5%).
| Demographics | Rating | Rank | Seniors Poverty Over the Age of 65 |
| Chinese | 100.0 /100 | #1 | Exceptional 8.3% |
| Tlingit-Haida | 100.0 /100 | #2 | Exceptional 8.3% |
| Norwegians | 100.0 /100 | #3 | Exceptional 8.7% |
| Swedes | 100.0 /100 | #4 | Exceptional 8.7% |
| Immigrants | India | 100.0 /100 | #5 | Exceptional 8.8% |
| Danes | 100.0 /100 | #6 | Exceptional 8.8% |
| Germans | 100.0 /100 | #7 | Exceptional 9.0% |
| Czechs | 100.0 /100 | #8 | Exceptional 9.0% |
| English | 100.0 /100 | #9 | Exceptional 9.1% |
| Lithuanians | 100.0 /100 | #10 | Exceptional 9.1% |
| Maltese | 99.9 /100 | #11 | Exceptional 9.1% |
| Scandinavians | 99.9 /100 | #12 | Exceptional 9.1% |
| Croatians | 99.9 /100 | #13 | Exceptional 9.1% |
| Poles | 99.9 /100 | #14 | Exceptional 9.1% |
| Dutch | 99.9 /100 | #15 | Exceptional 9.1% |