South American vs Immigrants from Congo Female Poverty Among 18-24 Year Olds
COMPARE
South American
Immigrants from Congo
Female Poverty Among 18-24 Year Olds
Female Poverty Among 18-24 Year Olds Comparison
South Americans
Immigrants from Congo
18.0%
FEMALE POVERTY AMONG 18-24 YEAR OLDS
100.0/ 100
METRIC RATING
38th/ 347
METRIC RANK
24.6%
FEMALE POVERTY AMONG 18-24 YEAR OLDS
0.0/ 100
METRIC RATING
320th/ 347
METRIC RANK
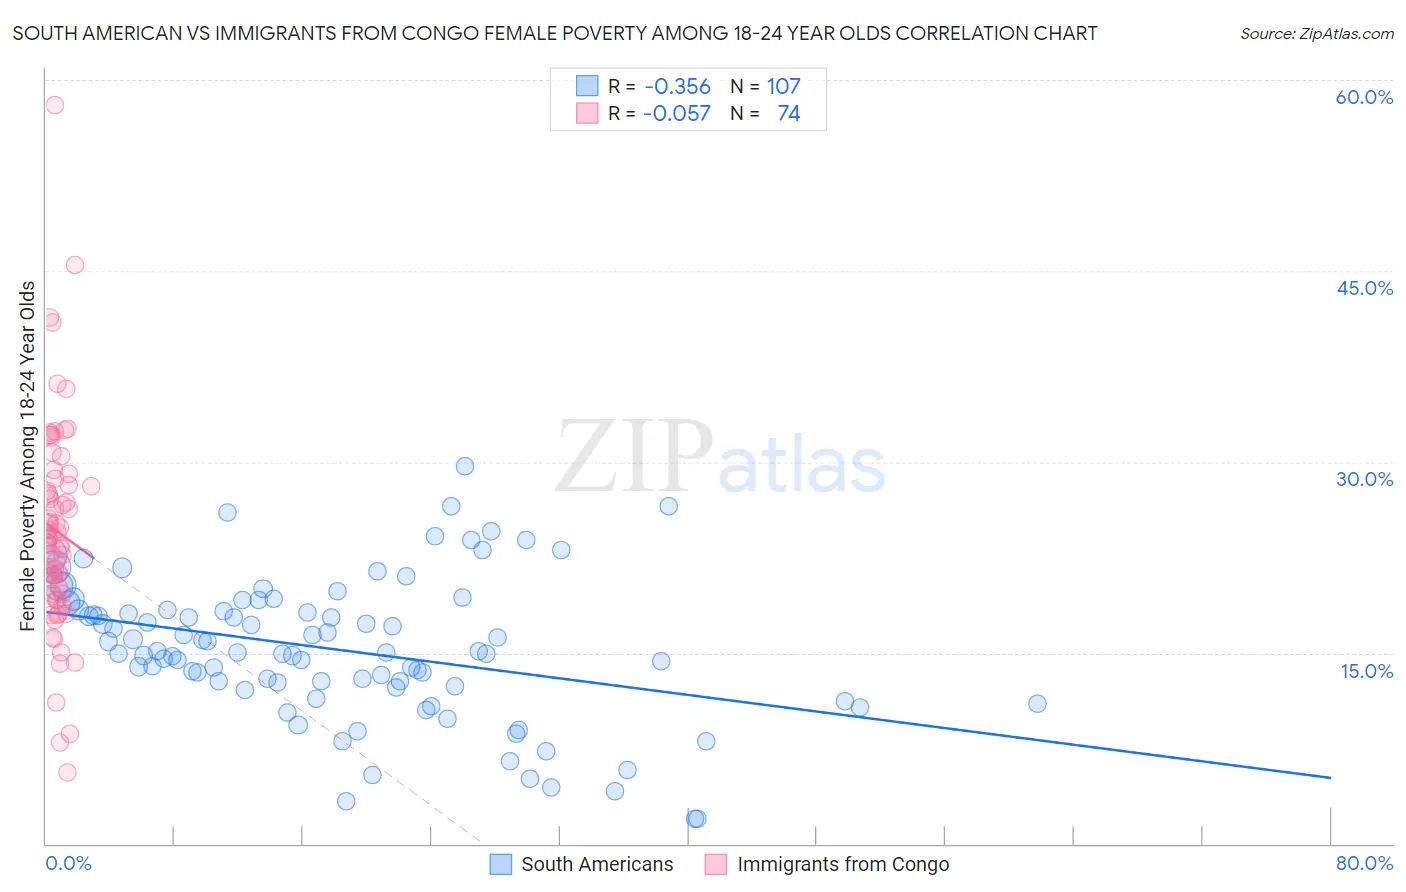
South American vs Immigrants from Congo Female Poverty Among 18-24 Year Olds Correlation Chart
The statistical analysis conducted on geographies consisting of 476,121,992 people shows a mild negative correlation between the proportion of South Americans and poverty level among females between the ages 18 and 24 in the United States with a correlation coefficient (R) of -0.356 and weighted average of 18.0%. Similarly, the statistical analysis conducted on geographies consisting of 91,799,806 people shows a slight negative correlation between the proportion of Immigrants from Congo and poverty level among females between the ages 18 and 24 in the United States with a correlation coefficient (R) of -0.057 and weighted average of 24.6%, a difference of 36.9%.
Female Poverty Among 18-24 Year Olds Correlation Summary
| Measurement | South American | Immigrants from Congo |
| Minimum | 2.0% | 5.6% |
| Maximum | 29.7% | 58.1% |
| Range | 27.7% | 52.5% |
| Mean | 15.3% | 24.6% |
| Median | 15.1% | 24.0% |
| Interquartile 25% (IQ1) | 12.3% | 19.6% |
| Interquartile 75% (IQ3) | 18.4% | 28.2% |
| Interquartile Range (IQR) | 6.0% | 8.6% |
| Standard Deviation (Sample) | 5.5% | 8.3% |
| Standard Deviation (Population) | 5.5% | 8.2% |
Similar Demographics by Female Poverty Among 18-24 Year Olds
Demographics Similar to South Americans by Female Poverty Among 18-24 Year Olds
In terms of female poverty among 18-24 year olds, the demographic groups most similar to South Americans are Puget Sound Salish (18.0%, a difference of 0.21%), Immigrants from Croatia (17.9%, a difference of 0.22%), Immigrants from Romania (18.0%, a difference of 0.24%), Immigrants from Argentina (18.0%, a difference of 0.25%), and Immigrants from South America (17.9%, a difference of 0.28%).
| Demographics | Rating | Rank | Female Poverty Among 18-24 Year Olds |
| Immigrants | Vietnam | 100.0 /100 | #31 | Exceptional 17.8% |
| Immigrants | Moldova | 100.0 /100 | #32 | Exceptional 17.9% |
| Native Hawaiians | 100.0 /100 | #33 | Exceptional 17.9% |
| Immigrants | Nicaragua | 100.0 /100 | #34 | Exceptional 17.9% |
| Immigrants | Greece | 100.0 /100 | #35 | Exceptional 17.9% |
| Immigrants | South America | 100.0 /100 | #36 | Exceptional 17.9% |
| Immigrants | Croatia | 100.0 /100 | #37 | Exceptional 17.9% |
| South Americans | 100.0 /100 | #38 | Exceptional 18.0% |
| Puget Sound Salish | 100.0 /100 | #39 | Exceptional 18.0% |
| Immigrants | Romania | 100.0 /100 | #40 | Exceptional 18.0% |
| Immigrants | Argentina | 100.0 /100 | #41 | Exceptional 18.0% |
| Bulgarians | 100.0 /100 | #42 | Exceptional 18.1% |
| Macedonians | 100.0 /100 | #43 | Exceptional 18.1% |
| Nicaraguans | 100.0 /100 | #44 | Exceptional 18.1% |
| Spanish American Indians | 100.0 /100 | #45 | Exceptional 18.1% |
Demographics Similar to Immigrants from Congo by Female Poverty Among 18-24 Year Olds
In terms of female poverty among 18-24 year olds, the demographic groups most similar to Immigrants from Congo are Dutch West Indian (24.5%, a difference of 0.30%), Chickasaw (24.5%, a difference of 0.40%), Osage (24.5%, a difference of 0.48%), Alsatian (24.4%, a difference of 0.78%), and Black/African American (24.3%, a difference of 1.1%).
| Demographics | Rating | Rank | Female Poverty Among 18-24 Year Olds |
| Creek | 0.0 /100 | #313 | Tragic 24.2% |
| Choctaw | 0.0 /100 | #314 | Tragic 24.3% |
| Blacks/African Americans | 0.0 /100 | #315 | Tragic 24.3% |
| Alsatians | 0.0 /100 | #316 | Tragic 24.4% |
| Osage | 0.0 /100 | #317 | Tragic 24.5% |
| Chickasaw | 0.0 /100 | #318 | Tragic 24.5% |
| Dutch West Indians | 0.0 /100 | #319 | Tragic 24.5% |
| Immigrants | Congo | 0.0 /100 | #320 | Tragic 24.6% |
| Immigrants | Zaire | 0.0 /100 | #321 | Tragic 25.1% |
| Somalis | 0.0 /100 | #322 | Tragic 25.1% |
| Arapaho | 0.0 /100 | #323 | Tragic 25.2% |
| German Russians | 0.0 /100 | #324 | Tragic 25.2% |
| Immigrants | Saudi Arabia | 0.0 /100 | #325 | Tragic 25.3% |
| Yakama | 0.0 /100 | #326 | Tragic 25.3% |
| Ute | 0.0 /100 | #327 | Tragic 25.4% |