South American vs Yugoslavian Female Poverty Among 18-24 Year Olds
COMPARE
South American
Yugoslavian
Female Poverty Among 18-24 Year Olds
Female Poverty Among 18-24 Year Olds Comparison
South Americans
Yugoslavians
18.0%
FEMALE POVERTY AMONG 18-24 YEAR OLDS
100.0/ 100
METRIC RATING
38th/ 347
METRIC RANK
19.8%
FEMALE POVERTY AMONG 18-24 YEAR OLDS
79.0/ 100
METRIC RATING
152nd/ 347
METRIC RANK
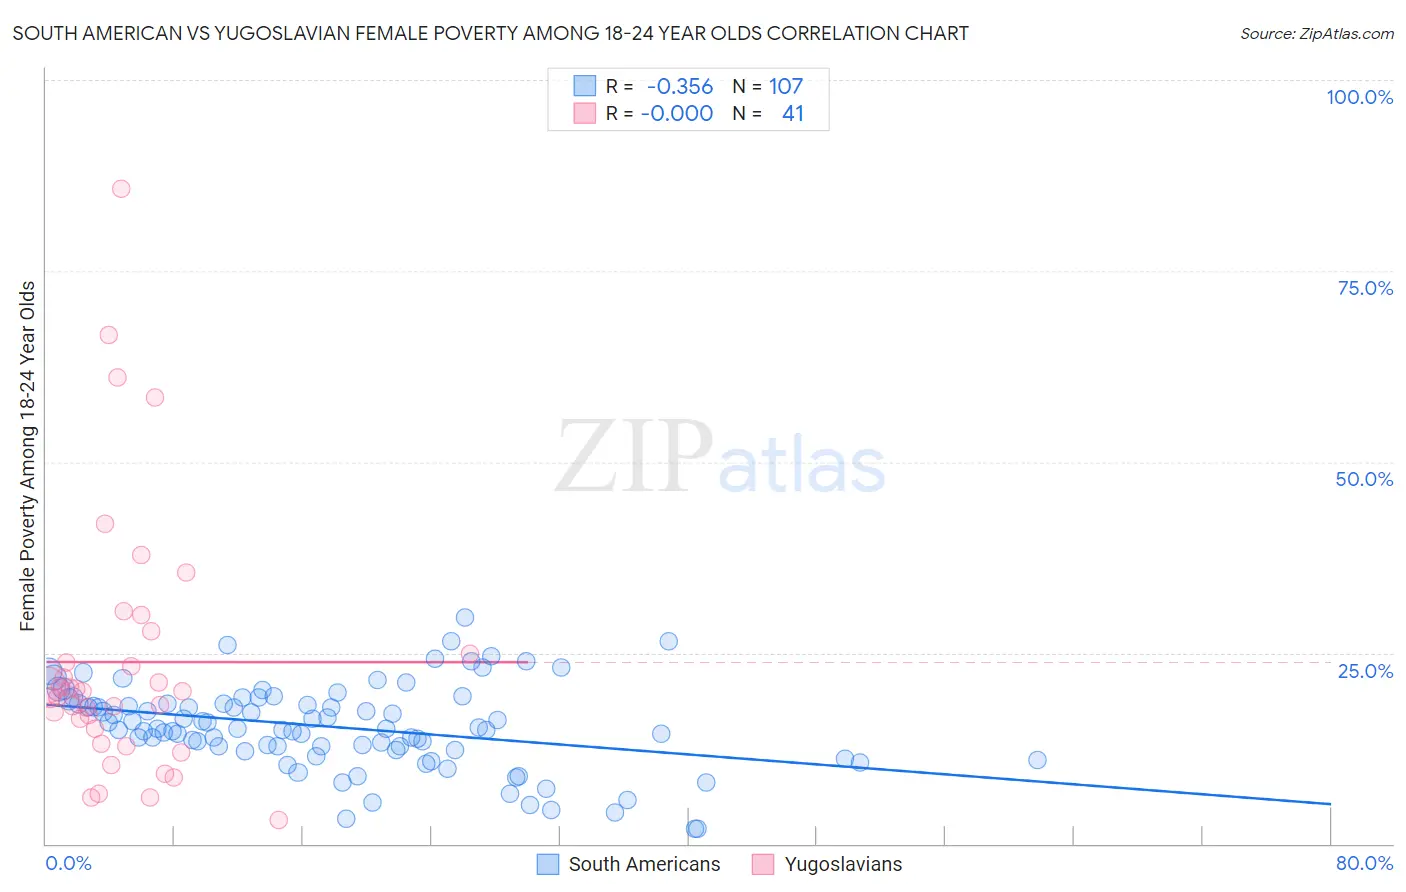
South American vs Yugoslavian Female Poverty Among 18-24 Year Olds Correlation Chart
The statistical analysis conducted on geographies consisting of 476,121,992 people shows a mild negative correlation between the proportion of South Americans and poverty level among females between the ages 18 and 24 in the United States with a correlation coefficient (R) of -0.356 and weighted average of 18.0%. Similarly, the statistical analysis conducted on geographies consisting of 280,461,515 people shows no correlation between the proportion of Yugoslavians and poverty level among females between the ages 18 and 24 in the United States with a correlation coefficient (R) of -0.000 and weighted average of 19.8%, a difference of 10.2%.
Female Poverty Among 18-24 Year Olds Correlation Summary
| Measurement | South American | Yugoslavian |
| Minimum | 2.0% | 3.2% |
| Maximum | 29.7% | 85.7% |
| Range | 27.7% | 82.5% |
| Mean | 15.3% | 23.8% |
| Median | 15.1% | 20.0% |
| Interquartile 25% (IQ1) | 12.3% | 14.1% |
| Interquartile 75% (IQ3) | 18.4% | 26.3% |
| Interquartile Range (IQR) | 6.0% | 12.2% |
| Standard Deviation (Sample) | 5.5% | 17.2% |
| Standard Deviation (Population) | 5.5% | 17.0% |
Similar Demographics by Female Poverty Among 18-24 Year Olds
Demographics Similar to South Americans by Female Poverty Among 18-24 Year Olds
In terms of female poverty among 18-24 year olds, the demographic groups most similar to South Americans are Puget Sound Salish (18.0%, a difference of 0.21%), Immigrants from Croatia (17.9%, a difference of 0.22%), Immigrants from Romania (18.0%, a difference of 0.24%), Immigrants from Argentina (18.0%, a difference of 0.25%), and Immigrants from South America (17.9%, a difference of 0.28%).
| Demographics | Rating | Rank | Female Poverty Among 18-24 Year Olds |
| Immigrants | Vietnam | 100.0 /100 | #31 | Exceptional 17.8% |
| Immigrants | Moldova | 100.0 /100 | #32 | Exceptional 17.9% |
| Native Hawaiians | 100.0 /100 | #33 | Exceptional 17.9% |
| Immigrants | Nicaragua | 100.0 /100 | #34 | Exceptional 17.9% |
| Immigrants | Greece | 100.0 /100 | #35 | Exceptional 17.9% |
| Immigrants | South America | 100.0 /100 | #36 | Exceptional 17.9% |
| Immigrants | Croatia | 100.0 /100 | #37 | Exceptional 17.9% |
| South Americans | 100.0 /100 | #38 | Exceptional 18.0% |
| Puget Sound Salish | 100.0 /100 | #39 | Exceptional 18.0% |
| Immigrants | Romania | 100.0 /100 | #40 | Exceptional 18.0% |
| Immigrants | Argentina | 100.0 /100 | #41 | Exceptional 18.0% |
| Bulgarians | 100.0 /100 | #42 | Exceptional 18.1% |
| Macedonians | 100.0 /100 | #43 | Exceptional 18.1% |
| Nicaraguans | 100.0 /100 | #44 | Exceptional 18.1% |
| Spanish American Indians | 100.0 /100 | #45 | Exceptional 18.1% |
Demographics Similar to Yugoslavians by Female Poverty Among 18-24 Year Olds
In terms of female poverty among 18-24 year olds, the demographic groups most similar to Yugoslavians are Immigrants from Eastern Asia (19.8%, a difference of 0.050%), Immigrants from Japan (19.8%, a difference of 0.060%), Syrian (19.8%, a difference of 0.090%), Immigrants from Oceania (19.7%, a difference of 0.17%), and Immigrants from Zimbabwe (19.8%, a difference of 0.17%).
| Demographics | Rating | Rank | Female Poverty Among 18-24 Year Olds |
| Canadians | 83.8 /100 | #145 | Excellent 19.7% |
| Immigrants | Bosnia and Herzegovina | 83.6 /100 | #146 | Excellent 19.7% |
| Immigrants | Austria | 83.1 /100 | #147 | Excellent 19.7% |
| Immigrants | Latin America | 81.3 /100 | #148 | Excellent 19.7% |
| Immigrants | Oceania | 81.2 /100 | #149 | Excellent 19.7% |
| Syrians | 80.2 /100 | #150 | Excellent 19.8% |
| Immigrants | Eastern Asia | 79.7 /100 | #151 | Good 19.8% |
| Yugoslavians | 79.0 /100 | #152 | Good 19.8% |
| Immigrants | Japan | 78.1 /100 | #153 | Good 19.8% |
| Immigrants | Zimbabwe | 76.7 /100 | #154 | Good 19.8% |
| Hungarians | 76.6 /100 | #155 | Good 19.8% |
| Immigrants | Belgium | 76.4 /100 | #156 | Good 19.8% |
| Danes | 75.5 /100 | #157 | Good 19.8% |
| Immigrants | Lebanon | 75.3 /100 | #158 | Good 19.8% |
| Trinidadians and Tobagonians | 74.4 /100 | #159 | Good 19.8% |