Immigrants from Kuwait vs Immigrants from Congo Female Poverty Among 18-24 Year Olds
COMPARE
Immigrants from Kuwait
Immigrants from Congo
Female Poverty Among 18-24 Year Olds
Female Poverty Among 18-24 Year Olds Comparison
Immigrants from Kuwait
Immigrants from Congo
23.0%
FEMALE POVERTY AMONG 18-24 YEAR OLDS
0.0/ 100
METRIC RATING
305th/ 347
METRIC RANK
24.6%
FEMALE POVERTY AMONG 18-24 YEAR OLDS
0.0/ 100
METRIC RATING
320th/ 347
METRIC RANK
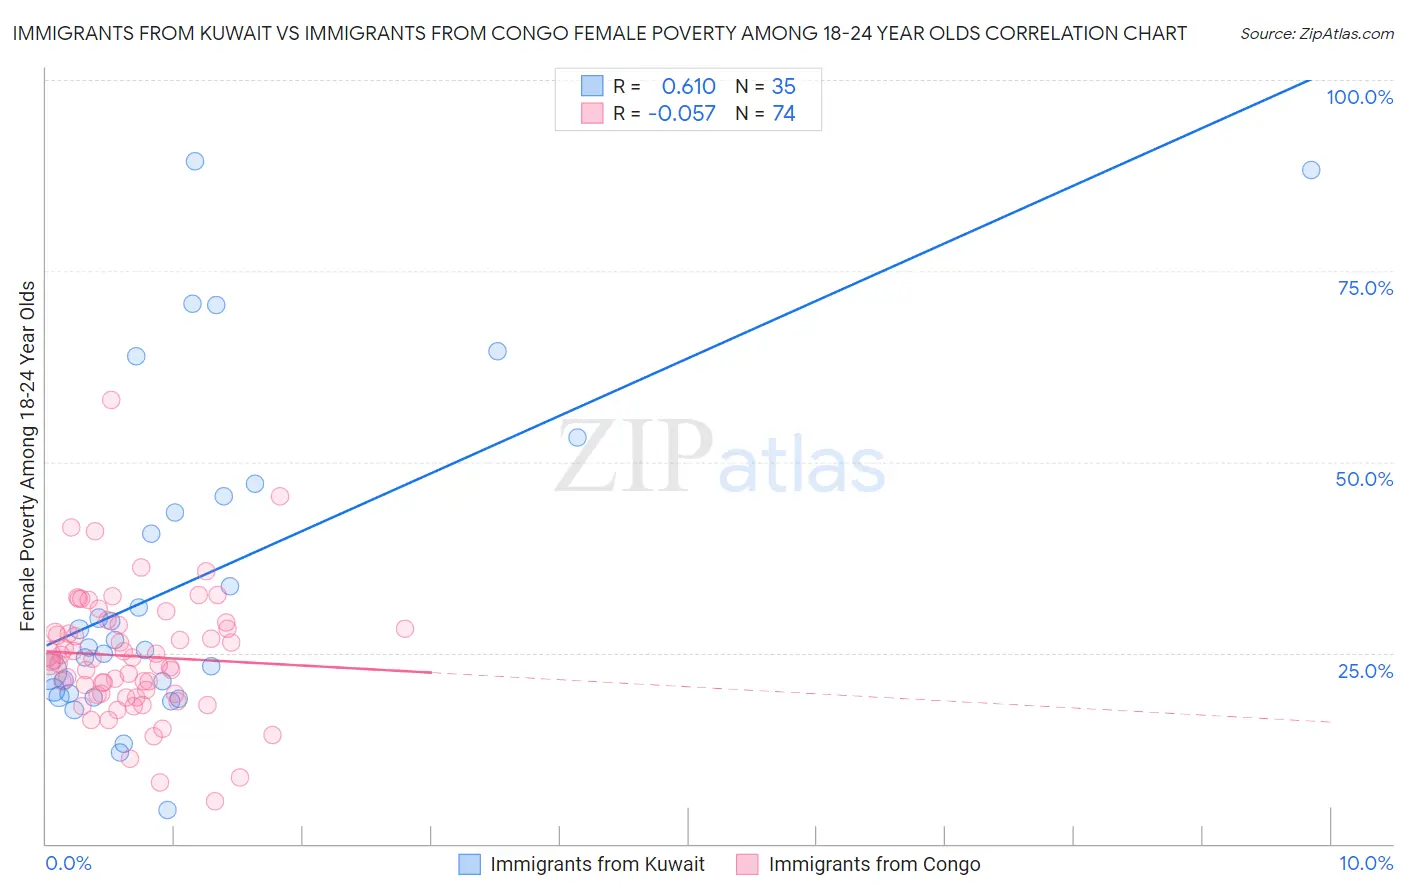
Immigrants from Kuwait vs Immigrants from Congo Female Poverty Among 18-24 Year Olds Correlation Chart
The statistical analysis conducted on geographies consisting of 136,006,240 people shows a significant positive correlation between the proportion of Immigrants from Kuwait and poverty level among females between the ages 18 and 24 in the United States with a correlation coefficient (R) of 0.610 and weighted average of 23.0%. Similarly, the statistical analysis conducted on geographies consisting of 91,799,806 people shows a slight negative correlation between the proportion of Immigrants from Congo and poverty level among females between the ages 18 and 24 in the United States with a correlation coefficient (R) of -0.057 and weighted average of 24.6%, a difference of 6.7%.
Female Poverty Among 18-24 Year Olds Correlation Summary
| Measurement | Immigrants from Kuwait | Immigrants from Congo |
| Minimum | 4.4% | 5.6% |
| Maximum | 89.4% | 58.1% |
| Range | 85.0% | 52.5% |
| Mean | 34.5% | 24.6% |
| Median | 25.6% | 24.0% |
| Interquartile 25% (IQ1) | 19.6% | 19.6% |
| Interquartile 75% (IQ3) | 45.5% | 28.2% |
| Interquartile Range (IQR) | 25.9% | 8.6% |
| Standard Deviation (Sample) | 21.5% | 8.3% |
| Standard Deviation (Population) | 21.2% | 8.2% |
Demographics Similar to Immigrants from Kuwait and Immigrants from Congo by Female Poverty Among 18-24 Year Olds
In terms of female poverty among 18-24 year olds, the demographic groups most similar to Immigrants from Kuwait are Sudanese (23.0%, a difference of 0.050%), Senegalese (23.0%, a difference of 0.19%), Iroquois (22.9%, a difference of 0.35%), Paiute (23.3%, a difference of 1.1%), and Cree (23.4%, a difference of 1.7%). Similarly, the demographic groups most similar to Immigrants from Congo are Dutch West Indian (24.5%, a difference of 0.30%), Chickasaw (24.5%, a difference of 0.40%), Osage (24.5%, a difference of 0.48%), Alsatian (24.4%, a difference of 0.78%), and Black/African American (24.3%, a difference of 1.1%).
| Demographics | Rating | Rank | Female Poverty Among 18-24 Year Olds |
| Iroquois | 0.0 /100 | #302 | Tragic 22.9% |
| Senegalese | 0.0 /100 | #303 | Tragic 23.0% |
| Sudanese | 0.0 /100 | #304 | Tragic 23.0% |
| Immigrants | Kuwait | 0.0 /100 | #305 | Tragic 23.0% |
| Paiute | 0.0 /100 | #306 | Tragic 23.3% |
| Cree | 0.0 /100 | #307 | Tragic 23.4% |
| Immigrants | Sudan | 0.0 /100 | #308 | Tragic 23.5% |
| Blackfeet | 0.0 /100 | #309 | Tragic 23.6% |
| Comanche | 0.0 /100 | #310 | Tragic 23.6% |
| Potawatomi | 0.0 /100 | #311 | Tragic 23.7% |
| Yuman | 0.0 /100 | #312 | Tragic 24.0% |
| Creek | 0.0 /100 | #313 | Tragic 24.2% |
| Choctaw | 0.0 /100 | #314 | Tragic 24.3% |
| Blacks/African Americans | 0.0 /100 | #315 | Tragic 24.3% |
| Alsatians | 0.0 /100 | #316 | Tragic 24.4% |
| Osage | 0.0 /100 | #317 | Tragic 24.5% |
| Chickasaw | 0.0 /100 | #318 | Tragic 24.5% |
| Dutch West Indians | 0.0 /100 | #319 | Tragic 24.5% |
| Immigrants | Congo | 0.0 /100 | #320 | Tragic 24.6% |
| Immigrants | Zaire | 0.0 /100 | #321 | Tragic 25.1% |
| Somalis | 0.0 /100 | #322 | Tragic 25.1% |